Back in February on the London Pentaho User-Group meeting I promised to make the contents of that presentation available as blog entries. This is the first of these three articles.
The Pentaho Reporting Engine supports several lay-outing strategies to create sophisticated reports easier and to simply the report creation process.
You can change the layout strategy of a band using the “layout” style-key on that band.
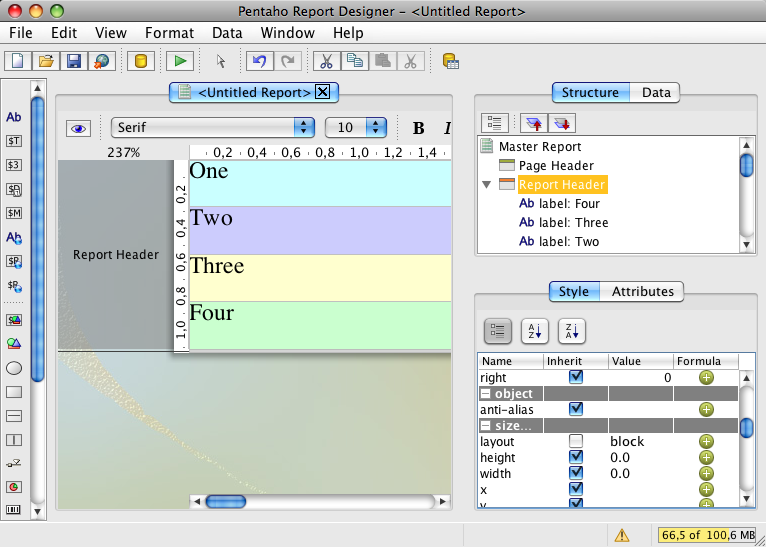
Canvas-Layout

A canvas layout positions elements freely on the area of the parent band. Elements have no relationship to each other during the lay-outing. Therefore if an element expands its size, it does not push elements out of the way. Expanding elements always increase the size of the parent band.
Elements inside a Canvas level band are positioned using the position::x and position::y style-keys.
The Canvas layout is the default layout for all new reports and bands.
If you are familiar with HTML and CSS, then think of this layout as a collection of absolutely positioned elements.
Block-Layout
Elements in a block layout band are laid out one after each other vertically. Block-level elements span the full width of the parent band. If a element expands it pushes all other elements down so that no element overlaps the other elements.
Master- and SubReport elements as well as Groups are always laid as block elements.
If you are familiar with HTML and CSS, think of this layout as a set of
elements.
Inline-Layout
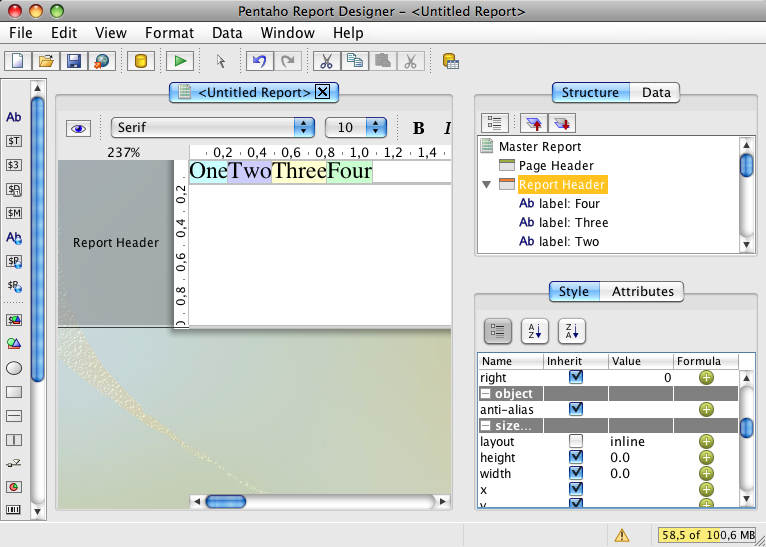
In an inline formatting context, boxes are laid out horizontally, one after the other, beginning at the top of a containing block. Horizontal margins, borders, and padding are respected between these boxes. The boxes may be aligned vertically in different ways: their bottoms or tops may be aligned, or the baselines of text within them may be aligned. The rectangular area that contains the boxes that form a line is called a line box.
A inline element that is placed in a non-inline layout band creates an artificial paragraph to wrap around this element during the lay-outing process. The most common use of this layout strategy is to produce rich-text content from several independent report elements.
If you are familiar with HTML and CSS, think of this layout as a set of elements.
Row-Layout
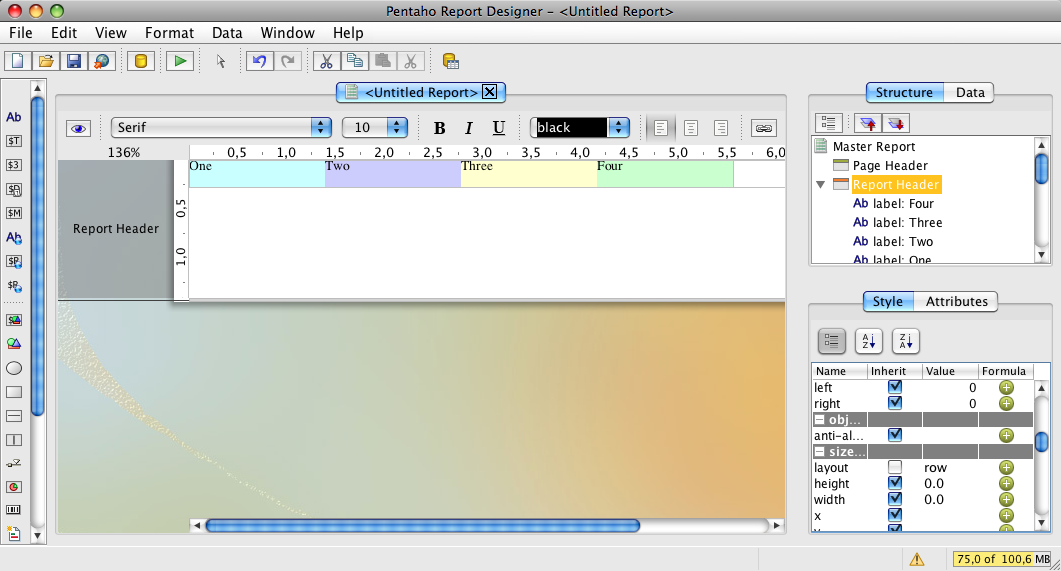
The row layout positions elements one after each other on the horizontal axis. All elements are printed in a single row, expanding their height as needed. If all elements should expand to the height of tallest element, set the min-height to “100%”.
Row-layout is a natural match for list reports, where multiple columns of data should be printed per row of data. When a element expands its width all other elements get pushed to the right.
If you are familiar with HTML and CSS, think of this layout as a HTML table with a single row of data.
When you use a row-layout for your list-reports, you will no longer need to layout elements manually. To create spacing between elements use either padding on your elements or place a empty band as padding element into the row layout band. The report design wizard makes use of the row-layout to position elements in the details band and details-header bands.
Combining layout strategies for better effects
You can combine several layout strategies in one root element by adding extra bands to your report. All elements placed into these bands will be governed by the band’s layout setting.
How to avoid that dynamic-height elements overlap other elements
You can use this to avoid overlapping elements in your report whenever you use “dynamic-height” elements and to create proper table-rows so that elements of the second row get pushed down by the expanding content of the first row.
Use the following steps to create a two-row details band.
- make your details band a block-layout by setting the layout-style of this band to “block”.
- Add two bands.
- Add the elements for the first row into the first band, and all elements for the second row into the second band.
That’s it. When your first row elements expand, your second row elements will be pushed down.
Download a sample report to see the row- and block-layouter in action.
Thomas,
Good to see the information. How about layout strategies for the parameters? i.e. allowing rudimentary positioning for parameters other than vertical, horizontal or flow?
Excellent article, Thomas! I’ve been using the layout style for a while and it really makes creating reports a lot easier!
Parameter layouting is something that had to fall short in the past – making parameters work reliable was more important. But yes, that is something that comes soon, as I do hate it when people have to abuse xactions or cdf-definitions as pure parameter input.
I also have the common request on my list to allow user-code inside parameter-widgets so that you can use your own JavaScript magic for everything.
Very insightful post. Thanks for the great illustrations.