Category Archives: Development

A bit of testing never hurts ..

Each time I touch the layouting subsystem of the reporting engine, I am scared to death. Layouting is a task that is not simple and almost never straight forward. Unless you are willing to consume loads of memory (up to the point where you would have to invent swapping system to free memory for larger reports) the layouting system needs to be balanced carefully.

The layout rules must be deterministic, complete and at the same time easy enough to understand to tell them to the user.

Our layouting engine is basically a huge state machine, where nodes get added and removed constantly to represent both an accurate picture of what has been processed (so that space is not allocated twice) and what is currently due to be processed. The engine itself streams data though its guts and only holds on to the parts that have not yet been printed. It allows us to have a really minimalistic memory footprint, nearly regardless of the total number of pages rendered. One page or a million, the amount of memory used stays a rather flat line.

On the negative side, we sit on a huge pile of states, all interdependent and interwoven and nearly impossible to simulate from outside. Some parts can be extracted, but the majority of the code needs to be run together to behave correctly.

Writing test cases for that is not fun – until now.

Over the last few weeks I wrote a set of “golden sample” tests. A golden sample is a test that runs a given report and compares its output against a known good state. Such tests cannot provide protection from unknown evils, but we are now at least in a position to validate that the existing reports run as before.

And best of all: These tests are easy to set up and easy to maintain. As long as we uphold the promise that old reports behave the same in newer reporting engines, we can just drop the report definitions into the sample pool, generate golden outputs and let them stay there for future generations of testers.

The test system could easily used outside of the development cycle as well. If you let your reports run against a test database you could verify whether the latest upgrade broke your reports or whether test system and production system *really* produce the same results. What do you think – would a “golden test” make sense in your organization?

An easy way of Printing Aggregations

Setting up a large number of aggregated values like sums, counts or averages can be a dreadful experience in the Pentaho Report Designer.

Calculations are performed by functions and expressions (let me call it just functions). These functions are added in the data tab of the report designer. Each function gets a name under which its result can be referenced. And then it needs to be configured properly. Usually, you have to set at least the field it should work on and the group on which it should reset.

Doing it for one field is not exciting, but ok. Doing it for 10 fields is no longer fun.

If you just want to print the result of that calculation, without ever using it as part of another computation, then here’s an easier way of aggregating data:

(1) Drag a number field onto your report and assign a field name to it (attribute common::fieldname).
(2) Set the aggregation you want to use via the attribute “wizard::aggregation-type”.
(3) Optional: Define the group on which you want to reset. If not defined, the current group is used.

This way of defining aggregations is used by the Report Design Wizard. To see a working example – just generate a report with it and add a summary on the fields.

Using Reporting Parameter for fun and profit

The new Pentaho Reporting 3.8 is the fourth release in a row where parameter played a important role. After ironing out all the easy problems, we are now in a state where we can think about creatively abusing the system.

There is one questions in the support centres that get repeated over and over again.

How do I limit the visible output types for a particular report?

Up until now, there was no sane answer. You either take it all, or you lock the report down to a single output type. But selecting just HTML and PDF, that was impossible.

The desired output for a report is controlled by the “output-target” parameter. The values for this parameter are defined somewhere deep inside the reporting engine. Every output target has its unique identifier, that tells both the type of the export (pageable or table) as well as the actual content type that is generated (text, html, pdf, and so on).

Output-target Description
table/html;page-mode=stream HTML as a single page, all report pagebreaks are ignored
table/html;page-mode=page HTML as a sequence of physical pages, manual and automatic pagebreaks are active
application/vnd.openxmlformats-officedocument.spreadsheetml.sheet;page-mode=flow Excel 2007 XLSX Workbook
table/excel;page-mode=flow Excel 97 Workbook
table/csv;page-mode=stream CSV output
table/rtf;page-mode=flow Rich-Text-Format
pageable/pdf PDF output
pageable/text Plain text
pageable/xml Pageable layouted XML
table/xml Table-XML output
pageable/X-AWT-Graphics;image-type=png A single report page as PNG
mime-message/text/html Mime-Email with HTML as body text and all style and images as inline attachments

Since Pentaho Reporting 3.8, we check whether the current report defines one of the known system parameter. If you define your own representation of such a parameter, we use your definition instead of the built-in ones.

Using that knowledge, it is easy to create a list parameter that defines a subset of the available output types. Drop your selection into a table-datasource, and define the parameter as one of the single-selection list-parameter types.

Server Side Printing

You can also invoke server side printing directly from the parameter UI without having to go through an XAction. Define a boolean parameter by creating a table with the following entries:

ID Value
false Do Not Print
true Print

Make sure you set the default value of your parameter to “false” or make false the first selection in your list, or you are likely to trigger printing involuntarily. Save the trees and so on.

If you want to print to a specific printer, you can do so by defining the “printer-name” parameter as well. And with the magic of the scriptable datasource, you can populate it with all known printers:

import javax.print.DocFlavor;
import javax.print.PrintService;
import javax.print.PrintServiceLookup;
import javax.print.attribute.standard.PrinterName;

import org.pentaho.reporting.engine.classic.core.modules.misc.tablemodel.TableModelInfo;
import org.pentaho.reporting.engine.classic.core.util.TypedTableModel; 


    PrintService[] services = PrintServiceLookup.lookupPrintServices(
        DocFlavor.SERVICE_FORMATTED.PAGEABLE, null);
    TypedTableModel tt = new TypedTableModel();
    tt.addColumn("ID", String.class);
    tt.addColumn("Value", String.class);
    for (int i = 0; i < services.length; i++)
    {
      PrintService service = services[i];
      PrinterName displayName = service.getAttribute(PrinterName.class);
      if (displayName != null)
      {
        tt.addRow(new Object[]{service.getName(), displayName.getValue()});
      }
      else
      {
        tt.addRow(new Object[]{service.getName(), service.getName()});
      }
    }
    return tt;
 

Element layouting strategies in Pentaho Reporting

Back in February on the London Pentaho User-Group meeting I promised to make the contents of that presentation available as blog entries. This is the first of these three articles.

The Pentaho Reporting Engine supports several lay-outing strategies to create sophisticated reports easier and to simply the report creation process.

You can change the layout strategy of a band using the “layout” style-key on that band.

Canvas-Layout

A canvas layout positions elements freely on the area of the parent band. Elements have no relationship to each other during the lay-outing. Therefore if an element expands its size, it does not push elements out of the way. Expanding elements always increase the size of the parent band.

Elements inside a Canvas level band are positioned using the position::x and position::y style-keys.

The Canvas layout is the default layout for all new reports and bands.

If you are familiar with HTML and CSS, then think of this layout as a collection of absolutely positioned elements.

Block-Layout

Elements in a block layout band are laid out one after each other vertically. Block-level elements span the full width of the parent band. If a element expands it pushes all other elements down so that no element overlaps the other elements.

Master- and SubReport elements as well as Groups are always laid as block elements.

If you are familiar with HTML and CSS, think of this layout as a set of

or

elements.

Inline-Layout

In an inline formatting context, boxes are laid out horizontally, one after the other, beginning at the top of a containing block. Horizontal margins, borders, and padding are respected between these boxes. The boxes may be aligned vertically in different ways: their bottoms or tops may be aligned, or the baselines of text within them may be aligned. The rectangular area that contains the boxes that form a line is called a line box.

A inline element that is placed in a non-inline layout band creates an artificial paragraph to wrap around this element during the lay-outing process. The most common use of this layout strategy is to produce rich-text content from several independent report elements.

If you are familiar with HTML and CSS, think of this layout as a set of elements.

Row-Layout

The row layout positions elements one after each other on the horizontal axis. All elements are printed in a single row, expanding their height as needed. If all elements should expand to the height of tallest element, set the min-height to “100%”.

Row-layout is a natural match for list reports, where multiple columns of data should be printed per row of data. When a element expands its width all other elements get pushed to the right.

If you are familiar with HTML and CSS, think of this layout as a HTML table with a single row of data.

When you use a row-layout for your list-reports, you will no longer need to layout elements manually. To create spacing between elements use either padding on your elements or place a empty band as padding element into the row layout band. The report design wizard makes use of the row-layout to position elements in the details band and details-header bands.

Combining layout strategies for better effects

You can combine several layout strategies in one root element by adding extra bands to your report. All elements placed into these bands will be governed by the band’s layout setting.

How to avoid that dynamic-height elements overlap other elements

You can use this to avoid overlapping elements in your report whenever you use “dynamic-height” elements and to create proper table-rows so that elements of the second row get pushed down by the expanding content of the first row.

Use the following steps to create a two-row details band.

  1. make your details band a block-layout by setting the layout-style of this band to “block”.
  2. Add two bands.
  3. Add the elements for the first row into the first band, and all elements for the second row into the second band.

That’s it. When your first row elements expand, your second row elements will be pushed down.

Download a sample report to see the row- and block-layouter in action.

Pentaho Report Designer 3.8: Data Caching is coming

I had been asked to get data caching into the next release. This release was called version 3.7.1, but with that latest change it will be named 3.8.

Data Caching has been asked for some time now, and was originally scheduled for version 4.0. One of our customers now requires faster response times during the parametrization phase. (That is one of the advantages of paying for a support contract: If you hit a roadblock, you are guaranteed to get a response in time.)

What can Data Caching do for you?

A smart cache avoids hitting your database every time you change your parameter. Of course, if the query and parameter combination is not in the cache, we go and fetch it. But any repeated query will be answered immediately.

If you have a slow data source this reduces your waiting time in both the BI-Server and Pentaho Report Designer. Less waiting means you get your job done faster.

Some JDBC drivers have no support for scrollable cursor (AS-400, for instance) or are badly implemented ([older] MySQL drivers). With the data-cache we now work around this. And by staging large data-sets locally, we can work around the drivers so that you no longer have to worry about that stuff.

And when will it come?

Data caching will be part of the February 2011 release.

Santa dropped CDA datasources

The first few 4.0 features are in.

In the subversion repository, you can now find a CDA data-factory (along with a report-designer GUI plugin). This new data-factory allows you to use a server side CDA data-source in your report. You will need a very recent build of CDA to make it work (as CDA 1.0 had a bug in its XML exporter).

Grab the CDA sources from http://code.google.com/p/pentaho-cda/ and build it with “ant resolve dist” and you are ready to go.


And secondly: Pentaho Reporting learned a couple of new barcodes. Our barcode element now uses Barcode4J in addition to Barbecue and thus adds support for the following barcodes:

  • EAN-8
  • EAN-128
  • UPC-E
  • Data-Matrix
  • Royal Mail
  • US-Postal Service Intelligent Mail

Merry Christmas!

Documentation Work in Progress

Over the last few weeks I lived with a split personality. OK, those who know me probably say: So what’s new then?

The new thing is: There’s documentation brewing. In a parallel effort of cooking the bug-fixes for the 3.7.1 release and writing documentation, I am preparing the scene for a better product now. The Pentaho Report Designer is nice, and quite a improvement to the previous releases, but at the moment it is only ‘commercial grade’ software en par with all other reporting offerings out there. For me, ‘commercial grade’ is never a badge of honour, as it usually means bug-fixes come late (if ever) and shiny check-box-list features get more energy than they deserve.

So let’s turn the rudder, hang the petty officer and then raise the skull flag – we’re going on a tour!

I already took the liberty to clean out the Wiki. Instead of presenting a S**t-load of obsolete documentation, I made the front page nearly empty. There is only one choice to make: Either go to the User Guide for Report Designer or try to dig your way through the random collection of the developer documentation.

Personally, for the next months to come, I will concentrate solely on the user guide. Developers? They have the source code. And if you are not willing to read the source code, then fork off $35 to get Will Gorman’s book. And if you are not willing to spend that much, then try your luck with Crystal Reports. 😉

The installation documentation as well as the first walk-through is finished now. All other chapters will come over time – whenever my time permits to do a bit here. And once again: I will concentrate on the novice documentation before I dwell into the heavy stuff. If you’re smart enough to get a decent report running, you are very likely to ‘get’ the complex stuff at some point. If not, well, there’s always the forum, as before.

While writing the documentation, I do stumble across weird behaviour. Of course, where ever possible, I fix that rather than just document the weirdness. Our JIRA system now has a new ‘component’ called ‘usability’. This is my personal bucket for all bugs for which I think that they make it hard to use the report designer, and which are easy to fix at the same time.

How can you help?

First – report bugs. Every bug. Have you ever double clicked on a list hoping to select a element in a dialog? File a Improvement request. Have you felt annoyed by dialogs being to small by default? Jira it! Do you feel unhappy that you have to click three times instead of clicking just once? Or is there a message that you find just confusing? Tell us about it.

Have you written How-Tos for your users? Tell us about it! If possible, add them to the wiki. And even if you cant add them (as you are not allowed to publish company property, for instance) – tell us about it. If you had to spend time explaining it, chances are high that we can improve either the workflow to make it easier to use or we can provide similar documentation, so that everyone can profit from it.

ENV-Fields: Why, When and How to use them

The reporting-environment came to life as a simple way to inject runtime information from the platform into a report. Ideally, a report should not know about details from the server it runs on. Certain parts of the server’s configuration, like the server’s base-url, easily change when the report travels from development to the test and then to the production environment.

Earlier versions relied on magical string replacements during the parse process to inject that kind of information. Parse-time modifications are generally a bad thing. They are insecure,
as every String manipulation of XML files is. If you manage to get a valid XML-Fragment into your replacement string, you can do everything. There is no way a GUI tool could be written for it. The injection magically happens everywhere without giving the user a say on that matter. At design time, or outside of the legacy code of the Pentaho Platform’s JFreeReportComponent, this replacement does not happen. I don’t want to explain that mad system to anyone, and surely neither do you!

And finally: It really makes it hard to do caching inside the reporting engine. For the reporting engine, these replaced strings look exactly like static strings and all of the sudden the cache is poisoned with a invalid copy.

Moving that information from parse-time to runtime solves that problem for me.

The report-environment is a special interface that allows third party systems like the Pentaho BI-Server to inject configuration settings in a safe and pre-defined way. That configuration information is then available to all expressions and functions. It completely eliminates all magic from the report processing.

A report-environment entry is not a parameter. A parameter is a external value that has been provided by the user or that has been calculated from end-user or report-designer input. A
report-environment property comes solely from the local runtime environment.

Inside the reporting engine, a report-environment setting is a single string. The setting is either one of the well-known environment-keys provided by the runtime implementation, a session-entry or a user-defined environment setting.

Well-Known Keys

  • serverBaseURL:
    The server’s base URL without any servlet context. Use this one to link to other resources on the same server.

    http://127.0.0.1:8080/
    
  • pentahoBaseURL:
    The server’s base url including the local web-application context. Use this one to link to other Pentaho Services.

    http://127.0.0.1:8080/pentaho
    
  • solutionRoot:
    The solution-repository root directory.
  • hostColorPort:
    The host name and port, without the protocol prefix or any path information.

    localhost:8080
    
  • requestContextPath:
    The context path of the web-application

    /pentaho
    
  • username:
    The username of the currently logged in user.
  • roles:
    The set of roles the user is assigned to.

Session keys

A environment setting starting with the prefix “session:” will be treated as a local session lookup. A session lookup will only work inside the Pentaho BI-Server. The BI-Server will compute the session attribute name by removing the “session:” prefix and will lookup the value in the users HTTP-Session instance.

If the value found there is a string it will be returned as valid entry. If the value is a string array, it will be converted into a CSV text using the excel quoting syntax (double-quote-character
are quote characters, and text containing either the comma, a quote character or a line-break will be quoted.

The value Joe, the horse, says "Ho" will become "Joe, the horse, says ""Ho""".

You can use the CSVARRAY formula function to parse that text back into a String-array inside the reporting engine.

User-Defined Environment setting

If a key does not match either one of the well-known keys or if the engine cannot identify it as a session-entry, it will be treated as user-defined setting. The reporting engine will consult the global configuration and will try to find the value by appending the environment key to the configuration prefix “org.pentaho.reporting.engine.classic.core.environment.“.

Therefore a environment lookup for the key “Foo” will query the global configuration for a configuration entry called “org.pentaho.reporting.engine.classic.core.environment.Foo“.

How to use them

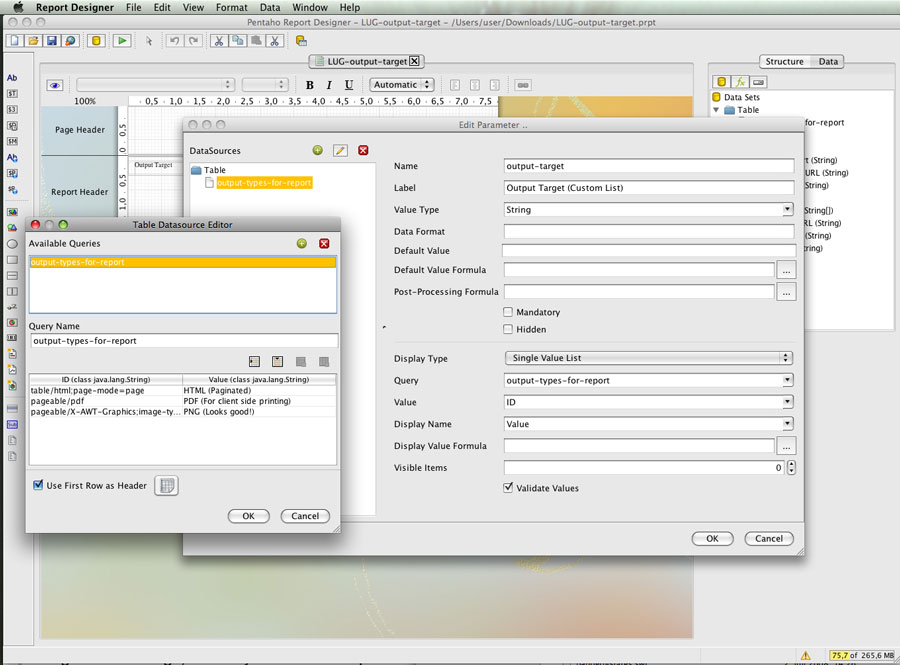
The report-environment can be accessed via the OpenFormula function
ENV“. Example:

=ENV("pentahoBaseURL")

The result of the lookup can be used in the same formula:

=ENV("pentahoBaseURL") & "/content/reporting/report.html?solution=steel-wheels&path=reports&name=BuyerReport.prpt"

You can also make the value accessible as a separate field. Place the ENV lookup into the post-processing formula of a hidden parameter or into the “formula” property of a OpenFormula-Expression and the value appears as field.

But there is a easier way to convert your environment lookups into fields!

Auto-mapping

The auto-mapping definitions allow the Pentaho Reporting Engine to automatically lookup a set of report-environment keys and to publish those values as “env::” fields. Which fields are auto-mapped is controlled by a set of configuration entries in the reporting engine’s global configuration.

A mapping rule follows the following syntax:

org.pentaho.reporting.engine.classic.core.env-mapping.=

If the environment string is a CSV string, you can tell the reporting engine about it and it will produce a field that contains a String-array.

org.pentaho.reporting.engine.classic.core.env-mapping.-array=

It is generally a good idea to keep your environment fields in a separate namespace by using the “env::” prefix for your fields. This way you will not run into conflicts with fields from your database or expressions later on. I also heavily recommend to try to keep the reference to the environment key in the name, this provides a sensible self-documenting entry.

Where to use Report-Environment fields

The predefined keys can be split into two groups. The first group, all path and URL related entries are used to calculate relative resource URLs, like logo images or HTML and JavaScript includes.

The second group ,”username” and “roles” is used to enforce security rules in datasources or on calculations.

The third use-case would be to provide system dependent parametrization, like printing static text. It is a easy way to include the department name or the name of the staging system (test, dev, production) in every report.

And last but not least: The environment is accessible to scripts and formulas, so it can be used as a system wide parametrization avenue.

Setting up session values

You can define the values for the session-keys of the report-environment inside the BI-Server with the help of a on-logon-XAction. Within that XAction, use a JavaScript-Rule to access the HttpSession object and to store the string-value on it.

Setting up global user-defined report-environment values

The global user-defined report-environment values are defined in the reporting engine’s global “classic-engine.properties” file. You will find that file in the Pentaho-Report-Designer’s “resources” directory. The BI-Server’s global reporting configuration file can be found in the WEB-INF/classses directory.

The report-environment is a simple and easy to setup way to make your reports more reusable. Whenever you find yourself changing reports manually  while transitioning them from development to testing or production, you now have the tools at hand to elimenate these manual steps.

Pentaho Reporting: More Reports Per Megabyte

Your server is short of RAM again? The 2 or 3 Gigabyte you allocated to the JVM are already full? Your poor server feels like it is dying a slow death? You need more RAM but are scratching on the limits already?

Then hear the news:

The upcoming Pentaho Reporting 3.7 release features yet another, invisible change to the engine’s behaviour. When you run a report to export the full document, we now run with truly minimal memory requirements.

Until recently, the reporting engine recorded fall-back states during the pagination run so that interactively browsing a paginated report becomes faster. Creating and storing those states is expensive – we have to record the computation state and the layout state for each page. The computation state is a snapshot of all functions and all other datasource and data-processing states. The layout state records the current layout result – how far has the layouting processed, which data is left unprocessed yet, where are the page-breaks and a huge load of internal caches.

In short: It eats memory like hell and takes time to process. And worst: for complete exports, no one is going to browse in a interactive print preview. So all that work is futile. All the memory wasted. The CPU burned out for nothing.

With version 3.7 of the Pentaho Reporting Engine, you will now see some great improvement on your server’s memory usage. Reports may be rendered slightly faster too. The only report-processor that still collects page-states is now the Graphics2D processor used for printing and the print preview.

So the next time you are asked to buy more RAM for your server, upgrade to BI-Server 3.7 and Pentaho Reporting 3.7 instead and get the most out of your precious memory chips. And best of all: You get all drill-linking features for free with it.

Supporting the old population – BI-Server 3.5.2 and 3.6.0

Now that the end of the traditional calendar year is near and Samhain is fast approaching, it is time to take care of the dead corpses of the old and existing production installations out there.

Personally, I am a big fan of instant upgrades. As soon as a new release is out, upgrade. Agreed, I am biased as every old installation means I have extra trouble with support and bug reports. Every old installation gone means less work for me. Isn’t that cool?

But there are those boring people with arguments like “cant upgrade a tested installation that is in production” and “never change a system that already works”. As those people also fall into the category of being “honourable Pentaho customers”, I quell the urge to scream “Get over it, what’s live without a bit of risk and fun”.

Pentaho Reporting 3.7.0 release ante portas

So here is my personal take on that problem. Note that my preference does not affect your support plans or dictates what Pentaho as company can and will do or can and will support. It just affects what I do in regard to feature and support requests that come to me via the open channels like the forum, e-mail or personally addressed blackmail.

This release will be out somewhere this year. Note how carefully I avoid any specific dates. It will be released when it is finished or when our Sales and Marketing team grow tired of waiting and invade the developer dungeon to get hold of the treasure.

Pentaho Reporting 3.7.0 will resurrect the dead BI-Server corpses

After that release I will branch the 3.7 codeline to retrofit it into the BI-Server 3.5.2 and 3.6.0 codebase. At the end of that process we will be able to upgrade the existing BI-Server 3.5.2 and 3.6 installations with the new reporting engine.

The server will still be mainly 3.5.2 code, as I do not plan to touch any of the BI-Server’s core projects. The “reporting-plugin” and the “pentaho-reporting-classic-engine” will be the only things that change.

The automatic parameter discovering in PRD for Drill-Linking will only be supported for links to reports. XActions and Analyzer do not support the correct parameter format and I dont feel tempted to mess with their sources (and potentially break things on the way). However, when you know the parameter names, you can always add the parameter to the “Manual Parameter” section of your Drill-down definition.

All other reporting related features will work as if you had a BI-Server 3.7.0 release.

Let the dead corpses rest in peace: No support from me for 0.8.9 and 0.8.10

I will make no effort whatsoever to support BI-Server 3.5.0 or anything that uses the old 0.8.something reporting engines. That code is so old that even my local necromancer would have trouble getting that back to life. I ended all support for that some time ago and although I happily answer questions from time to time, I will not open up that code in my shiny and clean IDE. If you are still working with that code, consider to upgrade, or be prepared to work on the branch alone.