Category Archives: Tech-Tips

Performance monitoring and tuning in Pentaho Reporting

Are your reports running slow? Do you have problems finding the solution to the problem? The performance of reports depends on many factors, and as many of these factors are interdependent, it is not always easy to untangle that mix.

But since the release of Pentaho Reporting 3.8, at least there is some help in your quest for performance with some additional log settings that spit out some performance metrics.

With this release, we added a bunch of loggers at strategic places to monitor the performance of running reports.

org.pentaho.reporting.engine.classic.core.ProfileReportProcessing=true

This setting enables the profiling mode via the logger “org.pentaho.reporting.engine.classic.core.layout.output.PerformanceProgressLogger”.
If this property is set to ‘true’, a new progress-monitor gets added to the report process. This monitor can print periodic status messages while the report is processed.

The Monitor itself can be tuned to output only the information that you seem most relevant. You can enable the logger to print a statement on every new page, on every new processing level or you can print periodic updates for every 5000 rows that have been processed by the engine.

org.pentaho.reporting.engine.classic.core.performance.LogPageProgress=true
org.pentaho.reporting.engine.classic.core.performance.LogLevelProgress=true
org.pentaho.reporting.engine.classic.core.performance.LogRowProgress=true
org.pentaho.reporting.engine.classic.core.DebugDataSources=true
org.pentaho.reporting.engine.classic.core.ProfileDataSources=true

Pentaho Reporting is a layouting engine that combines tabular data from a data source with calculated data and a layout description to produce the final documents. During the last few years I have not seen a report where the report functions or expressions formed the bottle neck of the report processing, so I happily ignore them unless everything else fails.

The database as bottle neck

If you are using SQL or MQL data sources, then your database may be responsible for the slow execution of the report.

Depending on the database, the use of scrollable result sets may be lethal to the report performance. With a scrollable result-set the database only supplies a sliding window of the data to the reporting engine. This reduces the reporting engine’s memory footprint, but puts a larger strain on the network and I/O capabilities of the system. If you pull a lot of data and the database is slow on supplying the data via a scrollable result-set then you pay a lot for accessing the data without knowing it. The query itself will return quickly, as it only initializes the cursor leaving the job of transferring the data out of the cost-equation.

You can test whether the data source is the problem by disabling the use of scrollable result sets via the report configuration setting:

org.pentaho.reporting.engine.classic.core.modules.misc.tablemodel.TableFactoryMode=simple

Be aware that the memory consumption will go up with this setting as we fully buffer the result set in the local memory. On the positive side, access to the local memory is blazing fast and therefore your report will run faster now.

I usually test the database first, as this test is simple to make and rules out a large chunk of the potential trouble makers.

The layout as bottle neck

In the reporting engine, the performance of the report is usually limited by the layouting and text processing that is necessary to produce the report. Performance is mainly dependent on the amount of content printed. The more content you generate, the more time we will need to perform all layout computations.

Subreports: Inline vs Banded

Large Inline-sub-reports are the most notorious reason for bad performance. The layouted output of a inline-sub-report is always stored in memory. Layouting pauses until the sub-report is fully generated and then inserted into the layout model and subsequently printed. The memory consumption for this layouting model is high, as the full layout model is kept in memory until the report is finished. If the amount of content of the sub-report is huge, you will run into out-of-memory exceptions in no time.

A inline-sub-report that consumes the full width of the root-level band should be converted into a banded sub-report. Banded sub-reports are layouted in a streaming fashion and output is generated while the sub-report is processed. The memory footprint for that operation is small as only the active band or the active page has to be held in memory.

Images loaded from HTTP-URLs

Some image generating scripts on the web can cause troubles with the reporting engine. For content loaded via HTTP connections, we rely on the cache control headers sent by the server. For this we check the “last-modified” header of the HTTP-response. If there is none, then we consider this file non-cacheable.

We check cache header against the original object by issuing a HEAD request to the URL. This may cause problems in case the image service provider does not properly implement a HEAD handler.

In Pentaho Reporting 3.8, we work around most of these troubles by assuming the worst from the web-authors. A non-cachable file is still cached for at least 10 seconds (the default configuration) as most programmers of web-services do not care, do not know or are not able to send a “last-modified” header or implement a HEAD response handler. For long running reports, this value must be increased to a larger number that matches at least the expected runtime length of the report.

You can also disable cache control completely, which will cause the reporting engine to never reload the content as long as the main resource cache still holds a reference to it.

To configure both settings, edit the “loader.properties” file in the root of your classpath and set the following properties:

# Controls the mandatory lifetime of HTTP objects before we check for updates on the object 
org.pentaho.reporting.libraries.resourceloader.config.url.FixedCacheDelay=10000

# Disable cache updates completely. Once a resource is loaded it stays loaded until its 
# end of life in the underlying resource cache has been reached.
org.pentaho.reporting.libraries.resourceloader.config.url.FixBrokenWebServiceDateHeader=false

Misconfigured caching as source of slow-downs

As a general rule of thumb: Caching must be configured properly via a valid EHCache file. If caching is disabled or misconfigured, then we will run into performance trouble when loading reports and resources. A misconfigured cache can considerably slow down reports if you use a resource-message, resource-label or resource-field element in the report. The resource elements load their translations via LibLoader, which in return depends on properly working caches to avoid repeated and expensive I/O operations.

You can configure EHCache via an “eh-cache.xml” file placed into the root of the classpath.

Output targets as bottle neck

Pageable outputs

A pageable report generates a stream of pages. Each page has the same height, even if the page is not fully filled with content. When a page is filled, the layouted page will be passed over to the output target to render it in either a Graphics2D context or a streaming output (PDF, Plaintext, Pageable-HTML etc).

When the content contains a manual pagebreak, the engine will consider the page as full. If the pagebreak is a “before-print” break, the break will be converted to a “after-break” on the previous band. To apply this change, the internal report states must be rolled back and parts of the report processing restarts to regenerate the layout with the new constraint in place. A similar roll-back happens, if the current
band does not fit on the page.

To avoid unnecessary rollbacks prefer “break-after” pagebreak markers over “break-before” markers.

In most cases, the pageable outputs will be fairly simple and non-problematic, as they only hold a minimal amount of data in memory.

Table outputs

A table export produces a table output from a fully layouted display model. A table export cannot handle overlapping elements and therefore has to remove such elements.

In versions prior to Pentaho Reporting 3.8, we also added some debug information to the layout nodes. This did increases the memory consumption but made developing reporting solutions easier. Although these debug settings should never be enabled in production environments, many users of the community edition may still run with these settings enabled. In Pentaho Reporting 3.8 we changed the built-in default so that no debug-information gets added. Those who could interpret the output probably know how to enable the setting, and everyone else just suffered the bad performance.

# Config settings for the 'classic-engine.properties' file
org.pentaho.reporting.engine.classic.core.modules.output.table.base.ReportCellConflicts=false
org.pentaho.reporting.engine.classic.core.modules.output.table.base.VerboseCellMarkers=false

Streaming HTML exports

In HTML exports, there are a few settings that can affect export performance.

org.pentaho.reporting.engine.classic.core.modules.output.table.html.CopyExternalImages=true

This setting controls whether images linked from HTTP(S) or FTP sources are linked from their original source or copied (and possibly recoded) into the output directory. The default is “true” as this ensures that reports always have the same image.

Set it to false if the image is dynamically generated and should always show the most recent view. Disabling this setting also avoid some I/O for copying and recoding the images during the report generation, although for most images used in the report this performance gain wont be noticeable at all.

org.pentaho.reporting.engine.classic.core.modules.output.table.html.InlineStyles=false
org.pentaho.reporting.engine.classic.core.modules.output.table.html.ExternalStyle=true
org.pentaho.reporting.engine.classic.core.modules.output.table.html.ForceBufferedWriting=true

The style settings and the buffered writing settings control how stylesheets are produced and whether the generated HTML output will be held in a buffer until the report processing is finished.

Style information can either be inlined, stored in a external *.css file or can be contained in the HEAD element of the generated HTML file (when Inlinestyles is set to false and ExternalStyle is also set to false).

Buffering is forced when styles need to be inserted into the element of a report. The Buffering configuration setting should be set to true if the resulting report is read by a browser, as browsers request all resources from the server as soon as they find a reference to them in the HTML stream. If a browser requests a stylesheet that has not yet been fully generated, the report
will not be rendered correctly.

It is safe to disable buffering if the styles are inlined, as the browser will not need to fetch a external stylesheet in that case. Inlined styles greatly increase the size of the generated HTML and may slow down the rendering of the generated HTML file tremendously if the file is large.

Buffered content will appear slower to the user than non-buffered content, as browsers render partial HTML pages while data is still received from the server. Buffering delays that rendering until the report is fully processed on the server.

Reports that are only written to disk or downloaded from the server to be archived and then forgotten should have buffering disabled so that they can be streamed directly to the client.

Buffering consumes memory and can potentially lead to OutOfMemory conditions on smaller servers if too many users request large reports at the same time. However, in most reasonable configurations, buffering is harmless. So far no browser is able to properly render a HTML file that is larger than 20 MB. So if excessive buffering causes troubles then rest assured that in case buffering works your browser surely wont.

Get query-columns with Advanced-(SQL,MDX,MQL)-DataSources at design time

In the Business world reports are inevitably driven by a data source. As soon as you assign a query to the report in the Pentaho Report Designer, Pentaho Reporting will invoke the query and shows you the columns of the query’s result. You then can drag-and-drop these fields into the report, select them from a drop-down for expressions or attributes that reference fields.

But as soon as you use any of the Advanced-DataSources, this comfort is gone. Advanced-DataSources do not have a valid query when designing the report. For these data-sources, the query text is computed when the report runs, using the parameter values and runtime information that is available at this time. At design time, this information is not available and thus there is no query to execute.

Luckily, there is a easy and simple way to solve this usability problem.

The key to the solution lays in the way the reporting engine evaluates calculated properties at runtime.

Calculations override static values

When the Pentaho report engine runs the report, calculations always override any design time value given. In the Pentaho Report Designer the design time value is specified in the column labelled “value”, while the calculated value is the result of evaluating the assigned formula or expression.

During design-time, while you are editing the report in the report designer, the editor only uses the specified “design-time-values”. It does not evaluate any of the assigned expressions.

As soon as you hit preview or if you execute the report on the Pentaho BI-platform on the server you enter the runtime mode. At this point, the reporting engine checks whether there is a expression assigned to the property and evaluates it. In that case, the expression’s calculated result is used and the design-time value is ignored. In case there is no expression defined, the reporting engine always uses the design-time value.

Armed with this knowledge, we can now provide a sensible design-time query as design-time value. To make this trick work properly, your static query must return the same columns as your calculated query will return.

How to avoid slow queries while designing the report

But what if your query is complex, expensive and just plain horrible to maintain or enter into the static value.

In this case you can make use of another property of the reporting engine. The Pentaho Reporting Engine has a well-defined way to find a suitable data source for the query at hand. Once the reporting engine has a query string, it will ask all ordinary data-sources, whether they can handle the query string given. This discovery is performed in the order the data sources have been defined on the report. Only if none of the ordinary data sources is able to handle the query at hand, the reporting engine asks the advanced data sources, whether they recognize the query.

Now, if you define a ordinary table-data-source, you can use this data-source as your design-time data-source by specifying the name of one of the defined queries in the “value” column of the report’s query attribute. As the reporting engine checks ordinary data sources first, the table-data-source will claim responsibility for this design-time query and will provide the result set for the design time. At runtime, the reporting engine will calculate the query string. The table-data-source will not recognized the query, and thus the Advanced DataDource can take its turn to execute the query and to return the runtime result set.

Avoid any database access at all while designing reports in the Report Designer

Last but not least: You can even use this trick to avoid any database access at all while being in design-mode.

For that trick to work, create both your runtime query using any data source you like. Additionally create a table-data-source with a table that mirrors your the structure of result set returned by the runtime data source. Make sure both data sources use different names for their recognized queries.

Now, on your report set the design-time value of the query attribute to the name of the table-data-source’s query. Set the formula to a formula that returns the runtime query.

="runtime-query"

Now, for design mode the report designer will hit the table-data-source and during preview or after publishing, you will automatically use the runtime data source.

With this knowledge, you should be able to work with Advanced-DataSources as comfortable as with any of the ordinary data sources.

MySQL with Pentaho Report Designer for those who dont read manuals

Several people in the forums seem to have severe problems setting up MySQL or understanding how MySQL works. They also seem to have severe problems reading the database manuals pointed out in the forum, insisting the problem lays within the Report Designer. So I am going to write up some simple explanations on how to set up MySQL, how to configure the database users for access over the network and how to work around all the little and large weird quirks of that database. And then hopefully I just can point these users to here and never have to deal with it again.*


I do assume that you have MySQL installed and up and running. If not, then go and get PostgreSQL, a database I personally trust.

Connecting to a MySQL database – the basics

All the Pentaho tools and thus the Pentaho Report Designer are Java Applications and therefore use JDBC to access the databases. For other databases, the general rule is: Use the driver that ships with your database and keep the version numbers in sync.

To work with a MySQL database, you will need a suitable MySQL driver. In my experience MySQL drivers have not been the most stable nor most reliable drivers around. At Pentaho, we recommend to use the MySQL JDBC Driver version 5.1.10 as default driver, as this seems to be the most stable driver. Other versions may produce invalid results, and if you want to use any other version, make sure you test it carefully.

If you use the Pentaho Report Designer to create a connection, you will be asked for several properties. To connect to the database directly, select the connection mode “native”. Then enter your hostname or IP-address, port (default port number for MySQL is 3306) and username and password.

For generic JDBC database connections, you need the JDBC-URL, your username and password and optionally the connection properties:

Setting Value

Driver

The driver class to load. The name of the class that implements java.sql.Driver in MySQL Connector/J is com.mysql.jdbc.Driver.
JDBC-URL

The JDBC URL for the MySQL JDBC Driver uses the following format. Items in square brackets ([, ]) are optional.

jdbc:mysql://[host:port]/[database][?propertyName1][=propertyValue1][&propertyName2][=propertyValue2]...

If the host name is not specified, it defaults to 127.0.0.1. If the port is not specified, it defaults to 3306, the default port number for MySQL servers.


Username

Your user name as given to you by your database administrator. See below how MySQL translates that information and matches this against the internal user database.

Password

Your password for the connection.

To get the same connection as shown in the dialog screenshot above, you would have to specify the JDBC-URL:

jdbc:mysql://localhost:3306/sampledata

with username “pentaho_user” and “password” as password.

In most cases your database will be running on a different host than the computer you are editing reports or where the BI-Server is installed. When the database is running on a different computer, you will be able to distribute the work-load of answering requests and generating reports a lot better. If both the reporting server and the database share resources like the CPU, memory or disks, there is always the danger that both systems compete for resources and slow each other down unnecessarily.

User management and access control in MySQL

When you connect to a MySQL server, your identity is determined by the host from which you connect and the user name you specify. A MySQL server side user name is the combination of the user name you specified on the connection (“pentaho_user” in the example above) and the host from where you try to connect to the database server.

MySQL users are defined by their username and hostname and generally written in the format ‘username’@’hostname’.

In the example above we connect to the special host address ‘localhost’ (or by its IP address: 127.0.0.1). Only applications running on the same computer can make connections to this interface. By default a server will listening to these connections will see them as originating from “localhost” itself.

So in the above example, the full identity would be ‘pentaho_user’@’localhost’.

MySQL uses a two-stage authentication system. In the first stage it checks, whether you are allowed to connect to the database and validates your username and password. In the second stage MySQL checks whether you have the access rights to see the contents of the tables stored in the database or whether you are allowed to update or delete data.

When we try to establish a connection to the MySQL server, the server will check its local user database for an entry matching the username and password. If there is no user defined for the given hostname, you will see the error message

Host [...] is not allowed to connect to this MySQL server

The error message

Access denied for user 'pentaho_user'@'localhost' (using password: YES)

indicates that either the password is invalid or that this user has not been defined for connections from this host.

If you see the error message

ERROR 1044 (42000): Access denied for user 'pentaho_user'@'localhost' to database 'sampledata'

then you need to grant additional permissions to the user to allow access to the database.

Listing the defined users

MySQL stores all administrative information in a special system database called ‘mysql’. You can connect to this database like any other defined database. To see which users are defined, invoke the following SQL statement via the MySQL console:

SELECT User, Host FROM mysql.user;

MySQL will check your identity (username and host) against the user table. Both the user and the host must exist. If the table contains a host name called “%” this particular entry matches all hosts. If the table contains a empty user name, it matches any user name.

To allow the user ‘pentaho_user’ to connect from any localhost, you would need to have a matching entry for it in the table.

+------------------+-----------+
| User             | Host      |
+------------------+-----------+
| pentaho_user     | localhost | 
+------------------+-----------+

To allow connections for ‘pentaho_user’ from any host, a entry with ‘%’ as hostname must exist.

+------------------+-----------+
| User             | Host      |
+------------------+-----------+
| pentaho_user     | %         | 
+------------------+-----------+

Big fat warning: Even though both entries have the same user name (pentaho_user), they define two entirely different and unrelated identities for the database. It is totally possible and legal for ‘pentaho_user’ from localhost to have access to different databases than the same user for the other hosts. For MySQL these are two different entities.

Connections from Pentaho Report Designer via Connections from PhpMyAdmin or other Server Side Software

The MySQL identity system of treating users from different hosts as completely different entities can cause a lot of headaches, especially if you are not familiar with the underlying workings of the internet.

If your MySQL server is set up to only allow connections from specific hosts, you can run into problems where you can access the database from your web-server but not from within the report designer or vice versa.

Lets look at the most common usage scenarios:

Pentaho Reporting, the Web-Server and MySQL run on the same machine

This is a typical development scenario, where the developer installed all software on his own box for convenience.

+---------------+
| PRD-Host      |
+---------------+
| Web-Server    |
+---------------+
| My-SQL Server |
+---------------+

MySQL must be configured to allow access from ‘localhost’ and all connections in the report must use ‘localhost’ as the hostname for the MySQL connections.

A identity for ‘pentaho_user’@’localhost’ must exist.

+------------------+-----------+
| User             | Host      |
+------------------+-----------+
| pentaho_user     | localhost | 
+------------------+-----------+

Pentaho Reporting, the Web-Server and MySQL all use different machines

This is the typical production scenario. Both the database server and the web-server run on different machines for maximum performance. Both machines are usually installed in a server room or data centre.

+----------+          +------------+         +---------------+
| PRD-Host |  --+-->  | Web-Server |  ---->  | My-SQL Server |
+----------+    |     +------------+         +---------------+
                |                                 /|\ 
                +----------------------------------+

Both the developer sitting on the Pentaho Report Designer and the Web-Server need access to the database. While the developer creates the reports he needs access to the database (or a test database with a similar structure than the production database). When the report runs, the web-server must connect to the database as well to execute the reports.

Both the developer PC and the web-server must have entries for the user ‘pentaho_user’ in the user table.

+------------------+-----------------------------+
| User             | Host                        |
+------------------+-----------------------------+
| pentaho_user     | IP or hostname of webserver | 
+------------------+-----------------------------+
| pentaho_user     | IP or hostname of PRD-host  | 
+------------------+-----------------------------+

Alternatively, you could allow access from all hosts. Note that if your database server is not shielded by a firewall, then you may easily open your database to the world. Any self-respecting database administrator may try to strangulate you for suggesting such an configuration.

+------------------+-----------+
| User             | Host      |
+------------------+-----------+
| pentaho_user     | %         | 
+------------------+-----------+

The Web-Server and MySQL share the same machine

You find this set up occasionally in smaller hosting companies or from people who own just a single server. The database and web-server share the same machine, which is hosted in the data centre or server room. The developer runs the report designer on his own desktop machine.

+----------+          +---------------+ 
| PRD-Host |  --+-->  | Web-Server    |
+----------+    |     +---------------+
                +-->  | My-SQL server |
                      +---------------+

The web-server can access the MySQL server via ‘localhost’, while the developer needs to access the MySQL server from his own host outside of the server room.

+------------------+-----------------------------+
| User             | Host                        |
+------------------+-----------------------------+
| pentaho_user     | localhost                   | 
+------------------+-----------------------------+
| pentaho_user     | IP or hostname of PRD-host  | 
+------------------+-----------------------------+

So if you ever wondered why you can access your MySQL server from PhpMyAdmin or similar tools, but not from the Pentaho Report Designer, you should now be able to see the answer and to fix the problem.

You can find more information on this topic in the chapter about MySQL user management in the MySQL manual.

Fine grained access permissions

Even if you are able to connect to the database, you may not be able to query the database. The second stage of MySQL’s security system checks your identity against a set of defined permissions. These permissions control whether you are able to query or modify the data in the database or whether you are allowed to change the table structures or perform other administrative tasks.

Pentaho Reporting only queries the database. The Pentaho reporting tool does not modify data and does not perform any administrative tasks. All MySQL users need to have the “SELECT” permission on all objects you want to access from the reports.

To grant a specific user the permission to select data, use the following statement from the MySQL console.

GRANT SELECT ON database.* TO 'pentaho_user'@'localhost';

MySQL connection properties you should know

To make the JDBC driver work properly in MySQL, you will have to specify some additional connection properties. The driver’s default settings can cause severe problems for the reporting system. These defaults have been defined for historic releases of MySQL and are harmful these days.

Property Definition Comment
useCompression Use zlib compression when communicating with the server (true/false)? Defaults to ‘false’. Useful if you access a remote server through a low bandwidth connection. Disable for production systems.
passwordCharacterEncoding What character encoding is used for passwords? Leaving this set to the default value (null), uses the platform character set, which works for ISO8859_1 (i.e. “latin1”) passwords. For passwords in other character encodings, the encoding will have to be specified with this property, as it’s not possible for the driver to auto-detect this. If you are not using an all ASCII password and work outside the area of Western European languages, knowing about this is a life-saver.
characterEncoding If ‘useUnicode’ is set to true (which is the default), what Java character encoding should the driver use when dealing with strings? (defaults is to ‘autodetect’). If the encoding cannot be determined, then an exception will be raised. Sometimes MySQL server do detect the character set correctly and therefore return garbage when querying tables with non-ascii data. In this case this property can be used to override the autodetection of character sets.
functionsNeverReturnBlobs Should the driver always treat data from functions returning BLOBs as Strings – specifically to work around dubious metadata returned by the server for GROUP BY clauses? The MySQL JDBC-Driver returns string results of functions in SQL statements as byte-arrays. If you use any functions in SELECT statements, set this property to “true” or you will see garbage in the results.
emptyStringsConvertToZero Should the driver allow conversions from empty string fields to numeric values of ‘0’? MySQL treats empty strings or values as zero for numeric columns by default. If you need to see the values as they are stored in the database without helpful corrections from the JDBC driver, then set this flag to false.
zeroDateTimeBehavior What should happen when the driver encounters DATETIME values that are composed entirely of zeros (used by MySQL to represent invalid dates)? Valid values are “exception”, “round” and “convertToNull”. Use this if your select statement fails with an exception and you have a zero-date in it. Set it to ‘convertToNull’ to come to a more reasonable result.
serverTimezone Override detection/mapping of timezone. Used when timezone from server doesn’t map to Java timezone Use this if your dates returned by the database seem to be offset by some hours. Also see ‘useGmtMillisForDatetimes’, ‘useJDBCCompliantTimezoneShift’, ‘useLegacyDatetimeCode’ and ‘useTimezone’ for more time zone related functions.
holdResultsOpenOverStatementClose Should the driver leave the result sets open on Statement.close() (enabling violates JDBC specification) This can be a very helpful property for reports with subreports. It allows the Pentaho Reporting engine to process several server-side resultsets in parallel. Without this setting, the reporting engine will fully buffer result-sets in memory instead, which increases the memory consumption of the reporting system.

Further readings

If you have made it this far, then let me tell you one big hint: MySQL comes with a nice administration tool called My SQL Workbench which allows you to administrate the server without having to go through the command line.

* Yeah. At least I can fake hope, even when I don’t feel it.

Using Queries in Formulas in Pentaho Report Designer

One of the most powerful features of Pentaho Reporting is our ability to combine data from a multitude of datasources into a single report.

A report can be driven by a a query that reads an XML file. The results then parametrize a Web-Service. The web-service response then gets fed into a standard SQL query. And that finally drives the queries to a OLAP cube.

Sure, that example is a bit extreme, but possible out-of-the-box with Pentaho Reporting downloaded from SourceForge.

But we can do more: In Pentaho Reporting 3.8, you can also use two formula functions to query report datasources to incorporate the query-result into your report.

The SINGLEVALUEQUERY function retrieves a single values from the resultset. It always reads it from the first row of the result-set, either from the given column or simply taking the first column it finds.

SINGLEVALUEQUERY()
SINGLEVALUEQUERY([query:string]; [column:string])
SINGLEVALUEQUERY([query:string]; [column:string]; [querytimeout:integer])

As you can see, both column and query-timeout are optional parameter. The “query” given must be a valid report query – but more on that later.

The MULTIVALUEQUERY function works similar to the SINGLEVALUEQUERY formula function. But instead of retrieving just one value, it returns all values as an list.

In addition to the parameters of the SINGLEVALUEQUERY formula function, it also accepts a “query-limit” Integer-parameter, that restricts the number of values returned.

MULTIVALUEQUERY([query:string])
MULTIVALUEQUERY([query:string]; [column:string])
MULTIVALUEQUERY([query:string]; [column:string]; [querytimeout:integer])
MULTIVALUEQUERY([query:string]; [column:string]; [querytimeout:integer]; [limit:integer] )

So what is that ominous “query” parameter about?

In Pentaho Reporting, most data sources use logical names (or handles) to reference queries. Queries can be quite complex. SQL and MDX queries can be huge, and seeing queries printed out that cover several pages is rather normal. They are complex beasts that were difficult to write and even more difficult to keep free of errors. You don’t want to seem them being spread over throughout the reports.

All except for the “Advanced/Custom” data-sources hide these monsters behind easy to remember names. This allows us to encapsulate the complexities of the actual queries while at the same time documenting the purpose of the query itself. It is just easier to use “Sales-Persons-By-Region” in a report than to repeat the SQL statement everywhere.

Each report holds the logical name in its query attribute. When the query needs to be executed the reporting engine checks all declared data-sources to find one that recognizes the handle and that then returns a result-set for the assigned query.

For the formula system, I followed the same approach. It is easier to maintain formulas that use

SINGLEVALUEQUERY("sales-top-performer")

than to use

SINGLEVALUEQUERY("SELECT name, Sum(Sales) AS 'Sales' FROM SalesData ORDER BY 'Sales' LIMIT 1")

especially if that formula is going to be used several times in the report.

As a side note: As with calculated queries in the report itself, you can add a Advanced/Custom data source to compute a query at runtime. At that point, the second query would be valid.

These are the steps needed to use a SINGLEVALUEQUERY or MULTIVALUEQUERY formula function in a report for a given query.

(1) Define the data-source
(2) Add a query, test that it gets your expected result back.
(3) Reference the query in the formula

How do I parametrize the SINGLEVALUEQUERY or MULTIVALUEQUERY formula function?

For moth formula functions, parametrization happens implicitly. At runtime the reporting engine passes the current data-row, including all report parameter, the values from the report’s current result-set and the calculated function/expression values to the data-factory that executes the query.

Queries need to get parametrized as usual. For instance for SQL use the ${param} syntax. The underlying data-source itself specifies the names of the data-row columns it wants to use as parameters.

Example:

Lets assume that your report contains a field called “CUSTOMERNUMBER” and you want to retrieve the accumulated sales for the user via a SINGLEVALUEQUERY function.

(1) Define the SQL datasource on your report (or reuse one you already have defined).
(2) Add the query, name it “Sales-For-Customer” and provide the following SQL:

SELECT
     SUM("ORDERDETAILS"."QUANTITYORDERED" * 
     "ORDERDETAILS"."PRICEEACH") AS "Sales"
FROM
     "ORDERS" INNER JOIN "ORDERDETAILS" ON "ORDERS"."ORDERNUMBER" = "ORDERDETAILS"."ORDERNUMBER"
     INNER JOIN "CUSTOMERS" ON "ORDERS"."CUSTOMERNUMBER" = "CUSTOMERS"."CUSTOMERNUMBER"
WHERE 
     "CUSTOMERS"."CUSTOMERNUMBER" = ${CUSTOMERNUMBER}
GROUP BY 
     "CUSTOMERS"."CUSTOMERNUMBER"     

(3) Add a label, and edit the “value” attribute-expression. Set the following formula

=SINGLEVALUEQUERY("Sales-For-Customer")

Download the sample report

As you can see, there is not much magic in using the SINGLEVALUEQUERY and MULTIVALUEQUERY formula functions, but the effect they can have is powerful.

PS: Multiple queries with the same parameter values will be cached by the Report Data Cache

An easy way of Printing Aggregations

Setting up a large number of aggregated values like sums, counts or averages can be a dreadful experience in the Pentaho Report Designer.

Calculations are performed by functions and expressions (let me call it just functions). These functions are added in the data tab of the report designer. Each function gets a name under which its result can be referenced. And then it needs to be configured properly. Usually, you have to set at least the field it should work on and the group on which it should reset.

Doing it for one field is not exciting, but ok. Doing it for 10 fields is no longer fun.

If you just want to print the result of that calculation, without ever using it as part of another computation, then here’s an easier way of aggregating data:

(1) Drag a number field onto your report and assign a field name to it (attribute common::fieldname).
(2) Set the aggregation you want to use via the attribute “wizard::aggregation-type”.
(3) Optional: Define the group on which you want to reset. If not defined, the current group is used.

This way of defining aggregations is used by the Report Design Wizard. To see a working example – just generate a report with it and add a summary on the fields.

Using Reporting Parameter for fun and profit

The new Pentaho Reporting 3.8 is the fourth release in a row where parameter played a important role. After ironing out all the easy problems, we are now in a state where we can think about creatively abusing the system.

There is one questions in the support centres that get repeated over and over again.

How do I limit the visible output types for a particular report?

Up until now, there was no sane answer. You either take it all, or you lock the report down to a single output type. But selecting just HTML and PDF, that was impossible.

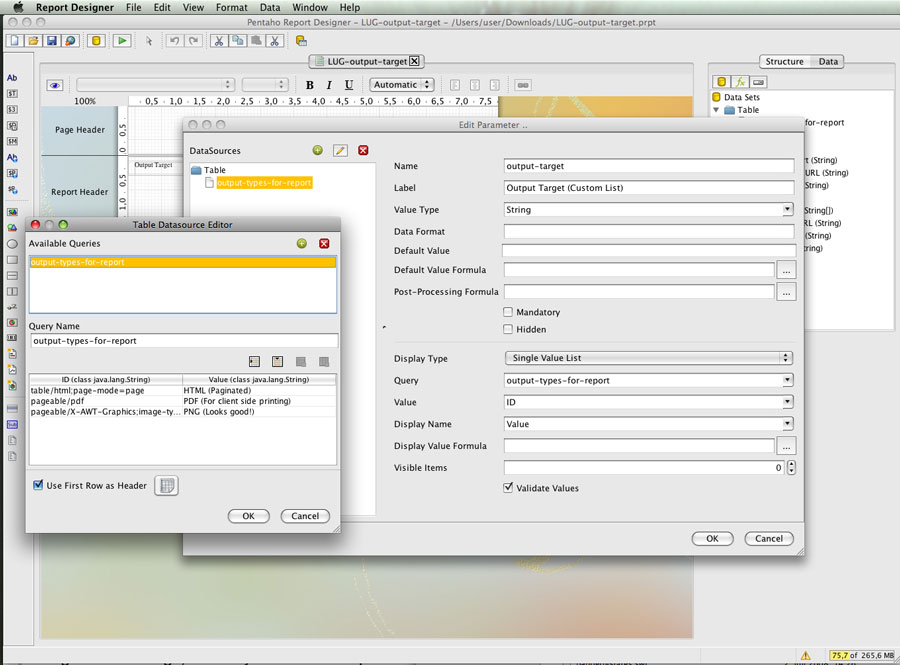
The desired output for a report is controlled by the “output-target” parameter. The values for this parameter are defined somewhere deep inside the reporting engine. Every output target has its unique identifier, that tells both the type of the export (pageable or table) as well as the actual content type that is generated (text, html, pdf, and so on).

Output-target Description
table/html;page-mode=stream HTML as a single page, all report pagebreaks are ignored
table/html;page-mode=page HTML as a sequence of physical pages, manual and automatic pagebreaks are active
application/vnd.openxmlformats-officedocument.spreadsheetml.sheet;page-mode=flow Excel 2007 XLSX Workbook
table/excel;page-mode=flow Excel 97 Workbook
table/csv;page-mode=stream CSV output
table/rtf;page-mode=flow Rich-Text-Format
pageable/pdf PDF output
pageable/text Plain text
pageable/xml Pageable layouted XML
table/xml Table-XML output
pageable/X-AWT-Graphics;image-type=png A single report page as PNG
mime-message/text/html Mime-Email with HTML as body text and all style and images as inline attachments

Since Pentaho Reporting 3.8, we check whether the current report defines one of the known system parameter. If you define your own representation of such a parameter, we use your definition instead of the built-in ones.

Using that knowledge, it is easy to create a list parameter that defines a subset of the available output types. Drop your selection into a table-datasource, and define the parameter as one of the single-selection list-parameter types.

Server Side Printing

You can also invoke server side printing directly from the parameter UI without having to go through an XAction. Define a boolean parameter by creating a table with the following entries:

ID Value
false Do Not Print
true Print

Make sure you set the default value of your parameter to “false” or make false the first selection in your list, or you are likely to trigger printing involuntarily. Save the trees and so on.

If you want to print to a specific printer, you can do so by defining the “printer-name” parameter as well. And with the magic of the scriptable datasource, you can populate it with all known printers:

import javax.print.DocFlavor;
import javax.print.PrintService;
import javax.print.PrintServiceLookup;
import javax.print.attribute.standard.PrinterName;

import org.pentaho.reporting.engine.classic.core.modules.misc.tablemodel.TableModelInfo;
import org.pentaho.reporting.engine.classic.core.util.TypedTableModel; 


    PrintService[] services = PrintServiceLookup.lookupPrintServices(
        DocFlavor.SERVICE_FORMATTED.PAGEABLE, null);
    TypedTableModel tt = new TypedTableModel();
    tt.addColumn("ID", String.class);
    tt.addColumn("Value", String.class);
    for (int i = 0; i < services.length; i++)
    {
      PrintService service = services[i];
      PrinterName displayName = service.getAttribute(PrinterName.class);
      if (displayName != null)
      {
        tt.addRow(new Object[]{service.getName(), displayName.getValue()});
      }
      else
      {
        tt.addRow(new Object[]{service.getName(), service.getName()});
      }
    }
    return tt;
 

Element layouting strategies in Pentaho Reporting

Back in February on the London Pentaho User-Group meeting I promised to make the contents of that presentation available as blog entries. This is the first of these three articles.

The Pentaho Reporting Engine supports several lay-outing strategies to create sophisticated reports easier and to simply the report creation process.

You can change the layout strategy of a band using the “layout” style-key on that band.

Canvas-Layout

A canvas layout positions elements freely on the area of the parent band. Elements have no relationship to each other during the lay-outing. Therefore if an element expands its size, it does not push elements out of the way. Expanding elements always increase the size of the parent band.

Elements inside a Canvas level band are positioned using the position::x and position::y style-keys.

The Canvas layout is the default layout for all new reports and bands.

If you are familiar with HTML and CSS, then think of this layout as a collection of absolutely positioned elements.

Block-Layout

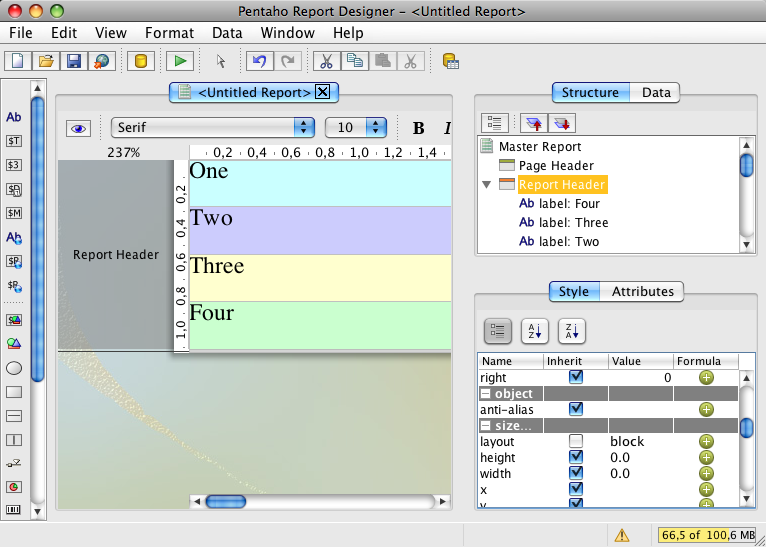
Elements in a block layout band are laid out one after each other vertically. Block-level elements span the full width of the parent band. If a element expands it pushes all other elements down so that no element overlaps the other elements.

Master- and SubReport elements as well as Groups are always laid as block elements.

If you are familiar with HTML and CSS, think of this layout as a set of

or

elements.

Inline-Layout

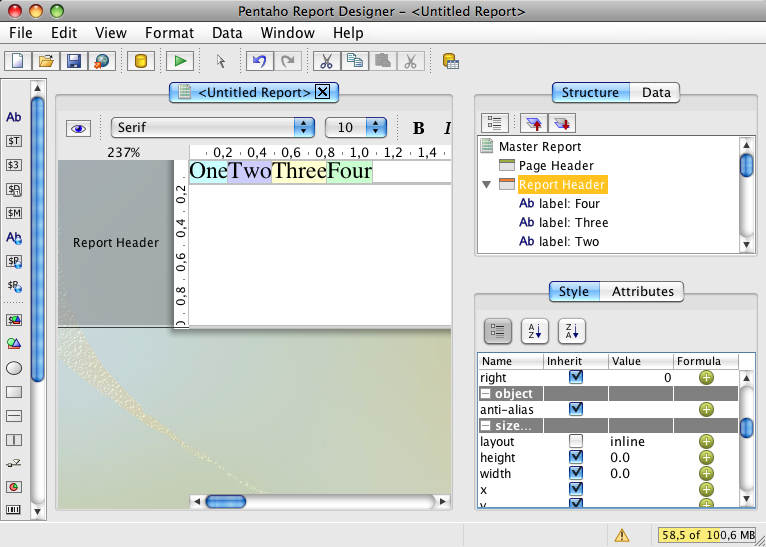
In an inline formatting context, boxes are laid out horizontally, one after the other, beginning at the top of a containing block. Horizontal margins, borders, and padding are respected between these boxes. The boxes may be aligned vertically in different ways: their bottoms or tops may be aligned, or the baselines of text within them may be aligned. The rectangular area that contains the boxes that form a line is called a line box.

A inline element that is placed in a non-inline layout band creates an artificial paragraph to wrap around this element during the lay-outing process. The most common use of this layout strategy is to produce rich-text content from several independent report elements.

If you are familiar with HTML and CSS, think of this layout as a set of elements.

Row-Layout

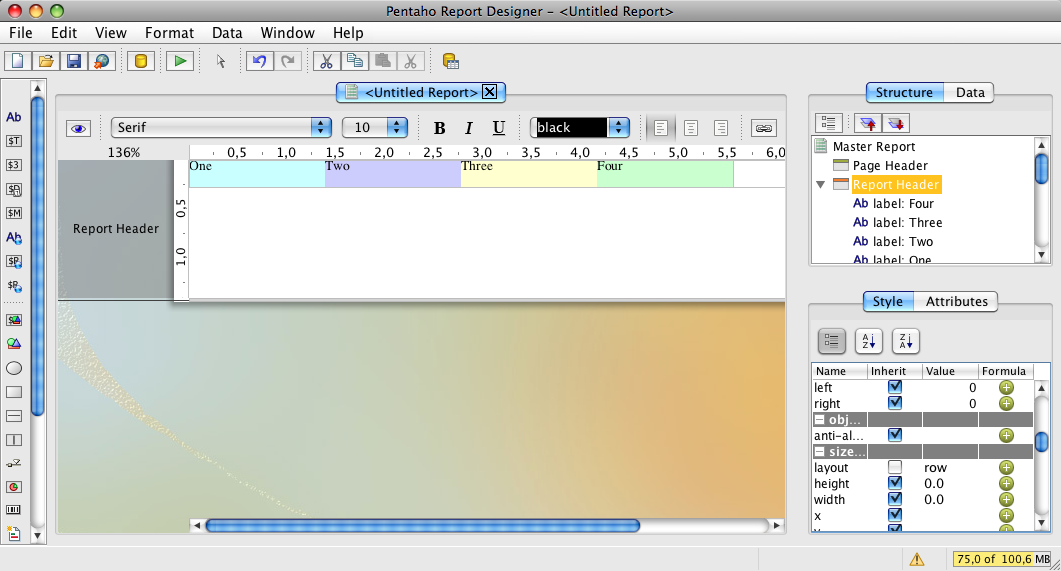
The row layout positions elements one after each other on the horizontal axis. All elements are printed in a single row, expanding their height as needed. If all elements should expand to the height of tallest element, set the min-height to “100%”.

Row-layout is a natural match for list reports, where multiple columns of data should be printed per row of data. When a element expands its width all other elements get pushed to the right.

If you are familiar with HTML and CSS, think of this layout as a HTML table with a single row of data.

When you use a row-layout for your list-reports, you will no longer need to layout elements manually. To create spacing between elements use either padding on your elements or place a empty band as padding element into the row layout band. The report design wizard makes use of the row-layout to position elements in the details band and details-header bands.

Combining layout strategies for better effects

You can combine several layout strategies in one root element by adding extra bands to your report. All elements placed into these bands will be governed by the band’s layout setting.

How to avoid that dynamic-height elements overlap other elements

You can use this to avoid overlapping elements in your report whenever you use “dynamic-height” elements and to create proper table-rows so that elements of the second row get pushed down by the expanding content of the first row.

Use the following steps to create a two-row details band.

  1. make your details band a block-layout by setting the layout-style of this band to “block”.
  2. Add two bands.
  3. Add the elements for the first row into the first band, and all elements for the second row into the second band.

That’s it. When your first row elements expand, your second row elements will be pushed down.

Download a sample report to see the row- and block-layouter in action.

Staying in touch with the Pentaho Reporting project

Whether you are a Pentaho Customer or a Pentaho Community Member, it is always nice to stay up to date with our progress. This especially matters if your favourite new feature or least-favourite bug get crunched right now.

So here’s how to do it:

(1) If you’re just interested in a single issue: Subscribe to the issue. There is no case yet? Create one, JIRA is open.

(2) If you want all issues reported in JIRA subscribe to a RSS feed.
Pentaho Reporting Issues RSS Feed

(3) Alternatively, subscribe to the Pentaho Reporting Developers List, and you get all JIRA updates into your Inbox.

(4) You want to know it all, every single commit? Subscribe to the Pentaho Reporting Commits Mailing List.

Personally, I use both the RSS feed and the mailing lists. The commits-list is most useful to see the source-code level changes coming in for reviewing those changes.

What is a report?

In its most basic form, a report is a document that contains information for the reader. When speaking of computer generated reports, these documents refine data from various sources into a human readable form. Report documents make it easy to distribute specific fact-based information throughout the company.

All reporting tools require well-defined data-sources to work with, so that the tools can formulate clear rules for querying, aggregation and data display. Computer generated Reports of all kinds consist mainly of tables and charts to convey their information to the recipients.

The term “report” or “reporting” is fairly imprecise these days and can mean several things. We differentiate two types of reports: “Analytical reports” and “Operational Reports”.

Analytical Reports

Analytical reports usually used for strategical (long term) decision making. They are marked by a high variation of questions asked, where the exact same queries may be asked relatively rarely. To answer the question summary information is more important than a detailed view on the transactions that caused them. In many cases, a time based comparison or aggregation is involved as well. And last but not least, these tools are used for explorative querying where one questions leads to even more questions.

To be useful in a explorative analysis, these tools need to be highly interactive. The resulting reports are usually not stored for long term use – and therefore Analytical Reporting Tools provide a limited set of tools to design the visual appearance of the resulting report. It is more important to get the answers fast and then to allow the user to move to the next question than to spend time on making the results look beautiful.

A chain of questions answered by Analytical Reporting Tools could look like this:

“What are the five top growing products over the last year?
How was the growth distributed over our sales regions?
Why is the southern region not performing as well as the other regions?”

or

“Show me the weekly shipping costs for our carriers?
Why is that one so high?
What product caused most of the shipping costs on this particular carrier?
How does the same product perform with the other carriers?”

Once the question is answered, it is highly unlikely that the same chain of questions is frequently asked again by other users.

Operational Reports

In contrast, a operational report answers tactical questions regarding the day to day operation of the company. The reports generated are business transaction orientated and support day-to-day activities of the company. The decisions based on these reports are immediate decisions made at the line-manager level. They contain a high level of details required to answer the question or requirements.

Operational reports usually come in form of lists or tables.

Typical questions answered by Operational Reports are:

“Give me the new orders for today”
“Show me the status of our stores and how many articles are left in store.”
“Print me a invoice for all customers served today”
“Print the daily accounts audit logs for our archives”

In Operational reports details are usually more important than the summary information. These reports answer questions that are asked frequently, so the same report can run a large number of times. For this reason, operational reports are “pre-canned” reports usually created by speciailzed report designers (power users or specialists). The design process for a good Operational report can easily take several hours to tweak the design of the resulting document to perfection.

The generated documents frequently get distributed to a larger audience in a process called “bursting”. Bursting is a old term used to describe the process of cutting down the large printouts on endless paper to send off the sheets of paper to their respective recipients.

Operational reports regularly get sent out to customers and business associates. As with all printed material, companies put a high emphasis on the graphical appearance of the resulting document to convery the right public image. They can run off the operational systems and operational reporting engines were traditionally part of ERP systems and other business applications that require printing capabilities.

Pentaho Reporting was originally developed as a operational reporting tool. Its detailed layouting and formatting capabilities stem from this requirement. As part of the reporting process, Pentaho Reporting can access and incorporate data from analytical datasources. The main focus for the Pentaho Report Designer lies in the document generation, and thus Pentaho Reporting is not a suitable replacement for analytical query tools.

The flexibility of Pentaho Reporting allows you to create Guided AdHoc Reports to widen the scope of your pre-designed reports.

ENV-Fields: Why, When and How to use them

The reporting-environment came to life as a simple way to inject runtime information from the platform into a report. Ideally, a report should not know about details from the server it runs on. Certain parts of the server’s configuration, like the server’s base-url, easily change when the report travels from development to the test and then to the production environment.

Earlier versions relied on magical string replacements during the parse process to inject that kind of information. Parse-time modifications are generally a bad thing. They are insecure,
as every String manipulation of XML files is. If you manage to get a valid XML-Fragment into your replacement string, you can do everything. There is no way a GUI tool could be written for it. The injection magically happens everywhere without giving the user a say on that matter. At design time, or outside of the legacy code of the Pentaho Platform’s JFreeReportComponent, this replacement does not happen. I don’t want to explain that mad system to anyone, and surely neither do you!

And finally: It really makes it hard to do caching inside the reporting engine. For the reporting engine, these replaced strings look exactly like static strings and all of the sudden the cache is poisoned with a invalid copy.

Moving that information from parse-time to runtime solves that problem for me.

The report-environment is a special interface that allows third party systems like the Pentaho BI-Server to inject configuration settings in a safe and pre-defined way. That configuration information is then available to all expressions and functions. It completely eliminates all magic from the report processing.

A report-environment entry is not a parameter. A parameter is a external value that has been provided by the user or that has been calculated from end-user or report-designer input. A
report-environment property comes solely from the local runtime environment.

Inside the reporting engine, a report-environment setting is a single string. The setting is either one of the well-known environment-keys provided by the runtime implementation, a session-entry or a user-defined environment setting.

Well-Known Keys

  • serverBaseURL:
    The server’s base URL without any servlet context. Use this one to link to other resources on the same server.

    http://127.0.0.1:8080/
    
  • pentahoBaseURL:
    The server’s base url including the local web-application context. Use this one to link to other Pentaho Services.

    http://127.0.0.1:8080/pentaho
    
  • solutionRoot:
    The solution-repository root directory.
  • hostColorPort:
    The host name and port, without the protocol prefix or any path information.

    localhost:8080
    
  • requestContextPath:
    The context path of the web-application

    /pentaho
    
  • username:
    The username of the currently logged in user.
  • roles:
    The set of roles the user is assigned to.

Session keys

A environment setting starting with the prefix “session:” will be treated as a local session lookup. A session lookup will only work inside the Pentaho BI-Server. The BI-Server will compute the session attribute name by removing the “session:” prefix and will lookup the value in the users HTTP-Session instance.

If the value found there is a string it will be returned as valid entry. If the value is a string array, it will be converted into a CSV text using the excel quoting syntax (double-quote-character
are quote characters, and text containing either the comma, a quote character or a line-break will be quoted.

The value Joe, the horse, says "Ho" will become "Joe, the horse, says ""Ho""".

You can use the CSVARRAY formula function to parse that text back into a String-array inside the reporting engine.

User-Defined Environment setting

If a key does not match either one of the well-known keys or if the engine cannot identify it as a session-entry, it will be treated as user-defined setting. The reporting engine will consult the global configuration and will try to find the value by appending the environment key to the configuration prefix “org.pentaho.reporting.engine.classic.core.environment.“.

Therefore a environment lookup for the key “Foo” will query the global configuration for a configuration entry called “org.pentaho.reporting.engine.classic.core.environment.Foo“.

How to use them

The report-environment can be accessed via the OpenFormula function
ENV“. Example:

=ENV("pentahoBaseURL")

The result of the lookup can be used in the same formula:

=ENV("pentahoBaseURL") & "/content/reporting/report.html?solution=steel-wheels&path=reports&name=BuyerReport.prpt"

You can also make the value accessible as a separate field. Place the ENV lookup into the post-processing formula of a hidden parameter or into the “formula” property of a OpenFormula-Expression and the value appears as field.

But there is a easier way to convert your environment lookups into fields!

Auto-mapping

The auto-mapping definitions allow the Pentaho Reporting Engine to automatically lookup a set of report-environment keys and to publish those values as “env::” fields. Which fields are auto-mapped is controlled by a set of configuration entries in the reporting engine’s global configuration.

A mapping rule follows the following syntax:

org.pentaho.reporting.engine.classic.core.env-mapping.=

If the environment string is a CSV string, you can tell the reporting engine about it and it will produce a field that contains a String-array.

org.pentaho.reporting.engine.classic.core.env-mapping.-array=

It is generally a good idea to keep your environment fields in a separate namespace by using the “env::” prefix for your fields. This way you will not run into conflicts with fields from your database or expressions later on. I also heavily recommend to try to keep the reference to the environment key in the name, this provides a sensible self-documenting entry.

Where to use Report-Environment fields

The predefined keys can be split into two groups. The first group, all path and URL related entries are used to calculate relative resource URLs, like logo images or HTML and JavaScript includes.

The second group ,”username” and “roles” is used to enforce security rules in datasources or on calculations.

The third use-case would be to provide system dependent parametrization, like printing static text. It is a easy way to include the department name or the name of the staging system (test, dev, production) in every report.

And last but not least: The environment is accessible to scripts and formulas, so it can be used as a system wide parametrization avenue.

Setting up session values

You can define the values for the session-keys of the report-environment inside the BI-Server with the help of a on-logon-XAction. Within that XAction, use a JavaScript-Rule to access the HttpSession object and to store the string-value on it.

Setting up global user-defined report-environment values

The global user-defined report-environment values are defined in the reporting engine’s global “classic-engine.properties” file. You will find that file in the Pentaho-Report-Designer’s “resources” directory. The BI-Server’s global reporting configuration file can be found in the WEB-INF/classses directory.

The report-environment is a simple and easy to setup way to make your reports more reusable. Whenever you find yourself changing reports manually  while transitioning them from development to testing or production, you now have the tools at hand to elimenate these manual steps.