Category Archives: Advanced Topic

Get query-columns with Advanced-(SQL,MDX,MQL)-DataSources at design time

In the Business world reports are inevitably driven by a data source. As soon as you assign a query to the report in the Pentaho Report Designer, Pentaho Reporting will invoke the query and shows you the columns of the query’s result. You then can drag-and-drop these fields into the report, select them from a drop-down for expressions or attributes that reference fields.

But as soon as you use any of the Advanced-DataSources, this comfort is gone. Advanced-DataSources do not have a valid query when designing the report. For these data-sources, the query text is computed when the report runs, using the parameter values and runtime information that is available at this time. At design time, this information is not available and thus there is no query to execute.

Luckily, there is a easy and simple way to solve this usability problem.

The key to the solution lays in the way the reporting engine evaluates calculated properties at runtime.

Calculations override static values

When the Pentaho report engine runs the report, calculations always override any design time value given. In the Pentaho Report Designer the design time value is specified in the column labelled “value”, while the calculated value is the result of evaluating the assigned formula or expression.

During design-time, while you are editing the report in the report designer, the editor only uses the specified “design-time-values”. It does not evaluate any of the assigned expressions.

As soon as you hit preview or if you execute the report on the Pentaho BI-platform on the server you enter the runtime mode. At this point, the reporting engine checks whether there is a expression assigned to the property and evaluates it. In that case, the expression’s calculated result is used and the design-time value is ignored. In case there is no expression defined, the reporting engine always uses the design-time value.

Armed with this knowledge, we can now provide a sensible design-time query as design-time value. To make this trick work properly, your static query must return the same columns as your calculated query will return.

How to avoid slow queries while designing the report

But what if your query is complex, expensive and just plain horrible to maintain or enter into the static value.

In this case you can make use of another property of the reporting engine. The Pentaho Reporting Engine has a well-defined way to find a suitable data source for the query at hand. Once the reporting engine has a query string, it will ask all ordinary data-sources, whether they can handle the query string given. This discovery is performed in the order the data sources have been defined on the report. Only if none of the ordinary data sources is able to handle the query at hand, the reporting engine asks the advanced data sources, whether they recognize the query.

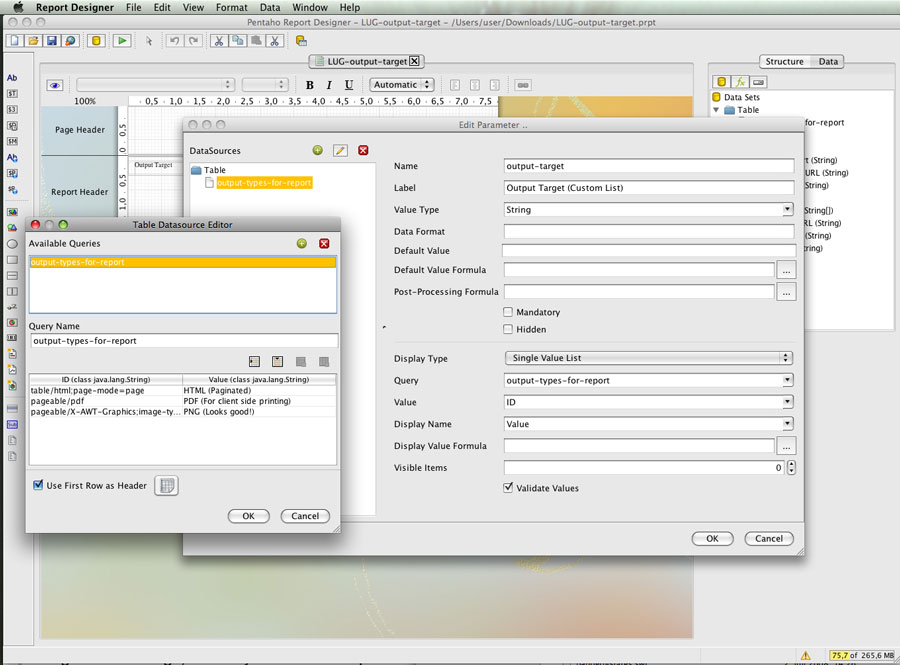
Now, if you define a ordinary table-data-source, you can use this data-source as your design-time data-source by specifying the name of one of the defined queries in the “value” column of the report’s query attribute. As the reporting engine checks ordinary data sources first, the table-data-source will claim responsibility for this design-time query and will provide the result set for the design time. At runtime, the reporting engine will calculate the query string. The table-data-source will not recognized the query, and thus the Advanced DataDource can take its turn to execute the query and to return the runtime result set.

Avoid any database access at all while designing reports in the Report Designer

Last but not least: You can even use this trick to avoid any database access at all while being in design-mode.

For that trick to work, create both your runtime query using any data source you like. Additionally create a table-data-source with a table that mirrors your the structure of result set returned by the runtime data source. Make sure both data sources use different names for their recognized queries.

Now, on your report set the design-time value of the query attribute to the name of the table-data-source’s query. Set the formula to a formula that returns the runtime query.

="runtime-query"

Now, for design mode the report designer will hit the table-data-source and during preview or after publishing, you will automatically use the runtime data source.

With this knowledge, you should be able to work with Advanced-DataSources as comfortable as with any of the ordinary data sources.

Using Queries in Formulas in Pentaho Report Designer

One of the most powerful features of Pentaho Reporting is our ability to combine data from a multitude of datasources into a single report.

A report can be driven by a a query that reads an XML file. The results then parametrize a Web-Service. The web-service response then gets fed into a standard SQL query. And that finally drives the queries to a OLAP cube.

Sure, that example is a bit extreme, but possible out-of-the-box with Pentaho Reporting downloaded from SourceForge.

But we can do more: In Pentaho Reporting 3.8, you can also use two formula functions to query report datasources to incorporate the query-result into your report.

The SINGLEVALUEQUERY function retrieves a single values from the resultset. It always reads it from the first row of the result-set, either from the given column or simply taking the first column it finds.

SINGLEVALUEQUERY()
SINGLEVALUEQUERY([query:string]; [column:string])
SINGLEVALUEQUERY([query:string]; [column:string]; [querytimeout:integer])

As you can see, both column and query-timeout are optional parameter. The “query” given must be a valid report query – but more on that later.

The MULTIVALUEQUERY function works similar to the SINGLEVALUEQUERY formula function. But instead of retrieving just one value, it returns all values as an list.

In addition to the parameters of the SINGLEVALUEQUERY formula function, it also accepts a “query-limit” Integer-parameter, that restricts the number of values returned.

MULTIVALUEQUERY([query:string])
MULTIVALUEQUERY([query:string]; [column:string])
MULTIVALUEQUERY([query:string]; [column:string]; [querytimeout:integer])
MULTIVALUEQUERY([query:string]; [column:string]; [querytimeout:integer]; [limit:integer] )

So what is that ominous “query” parameter about?

In Pentaho Reporting, most data sources use logical names (or handles) to reference queries. Queries can be quite complex. SQL and MDX queries can be huge, and seeing queries printed out that cover several pages is rather normal. They are complex beasts that were difficult to write and even more difficult to keep free of errors. You don’t want to seem them being spread over throughout the reports.

All except for the “Advanced/Custom” data-sources hide these monsters behind easy to remember names. This allows us to encapsulate the complexities of the actual queries while at the same time documenting the purpose of the query itself. It is just easier to use “Sales-Persons-By-Region” in a report than to repeat the SQL statement everywhere.

Each report holds the logical name in its query attribute. When the query needs to be executed the reporting engine checks all declared data-sources to find one that recognizes the handle and that then returns a result-set for the assigned query.

For the formula system, I followed the same approach. It is easier to maintain formulas that use

SINGLEVALUEQUERY("sales-top-performer")

than to use

SINGLEVALUEQUERY("SELECT name, Sum(Sales) AS 'Sales' FROM SalesData ORDER BY 'Sales' LIMIT 1")

especially if that formula is going to be used several times in the report.

As a side note: As with calculated queries in the report itself, you can add a Advanced/Custom data source to compute a query at runtime. At that point, the second query would be valid.

These are the steps needed to use a SINGLEVALUEQUERY or MULTIVALUEQUERY formula function in a report for a given query.

(1) Define the data-source
(2) Add a query, test that it gets your expected result back.
(3) Reference the query in the formula

How do I parametrize the SINGLEVALUEQUERY or MULTIVALUEQUERY formula function?

For moth formula functions, parametrization happens implicitly. At runtime the reporting engine passes the current data-row, including all report parameter, the values from the report’s current result-set and the calculated function/expression values to the data-factory that executes the query.

Queries need to get parametrized as usual. For instance for SQL use the ${param} syntax. The underlying data-source itself specifies the names of the data-row columns it wants to use as parameters.

Example:

Lets assume that your report contains a field called “CUSTOMERNUMBER” and you want to retrieve the accumulated sales for the user via a SINGLEVALUEQUERY function.

(1) Define the SQL datasource on your report (or reuse one you already have defined).
(2) Add the query, name it “Sales-For-Customer” and provide the following SQL:

SELECT
     SUM("ORDERDETAILS"."QUANTITYORDERED" * 
     "ORDERDETAILS"."PRICEEACH") AS "Sales"
FROM
     "ORDERS" INNER JOIN "ORDERDETAILS" ON "ORDERS"."ORDERNUMBER" = "ORDERDETAILS"."ORDERNUMBER"
     INNER JOIN "CUSTOMERS" ON "ORDERS"."CUSTOMERNUMBER" = "CUSTOMERS"."CUSTOMERNUMBER"
WHERE 
     "CUSTOMERS"."CUSTOMERNUMBER" = ${CUSTOMERNUMBER}
GROUP BY 
     "CUSTOMERS"."CUSTOMERNUMBER"     

(3) Add a label, and edit the “value” attribute-expression. Set the following formula

=SINGLEVALUEQUERY("Sales-For-Customer")

Download the sample report

As you can see, there is not much magic in using the SINGLEVALUEQUERY and MULTIVALUEQUERY formula functions, but the effect they can have is powerful.

PS: Multiple queries with the same parameter values will be cached by the Report Data Cache

Using Reporting Parameter for fun and profit

The new Pentaho Reporting 3.8 is the fourth release in a row where parameter played a important role. After ironing out all the easy problems, we are now in a state where we can think about creatively abusing the system.

There is one questions in the support centres that get repeated over and over again.

How do I limit the visible output types for a particular report?

Up until now, there was no sane answer. You either take it all, or you lock the report down to a single output type. But selecting just HTML and PDF, that was impossible.

The desired output for a report is controlled by the “output-target” parameter. The values for this parameter are defined somewhere deep inside the reporting engine. Every output target has its unique identifier, that tells both the type of the export (pageable or table) as well as the actual content type that is generated (text, html, pdf, and so on).

Output-target Description
table/html;page-mode=stream HTML as a single page, all report pagebreaks are ignored
table/html;page-mode=page HTML as a sequence of physical pages, manual and automatic pagebreaks are active
application/vnd.openxmlformats-officedocument.spreadsheetml.sheet;page-mode=flow Excel 2007 XLSX Workbook
table/excel;page-mode=flow Excel 97 Workbook
table/csv;page-mode=stream CSV output
table/rtf;page-mode=flow Rich-Text-Format
pageable/pdf PDF output
pageable/text Plain text
pageable/xml Pageable layouted XML
table/xml Table-XML output
pageable/X-AWT-Graphics;image-type=png A single report page as PNG
mime-message/text/html Mime-Email with HTML as body text and all style and images as inline attachments

Since Pentaho Reporting 3.8, we check whether the current report defines one of the known system parameter. If you define your own representation of such a parameter, we use your definition instead of the built-in ones.

Using that knowledge, it is easy to create a list parameter that defines a subset of the available output types. Drop your selection into a table-datasource, and define the parameter as one of the single-selection list-parameter types.

Server Side Printing

You can also invoke server side printing directly from the parameter UI without having to go through an XAction. Define a boolean parameter by creating a table with the following entries:

ID Value
false Do Not Print
true Print

Make sure you set the default value of your parameter to “false” or make false the first selection in your list, or you are likely to trigger printing involuntarily. Save the trees and so on.

If you want to print to a specific printer, you can do so by defining the “printer-name” parameter as well. And with the magic of the scriptable datasource, you can populate it with all known printers:

import javax.print.DocFlavor;
import javax.print.PrintService;
import javax.print.PrintServiceLookup;
import javax.print.attribute.standard.PrinterName;

import org.pentaho.reporting.engine.classic.core.modules.misc.tablemodel.TableModelInfo;
import org.pentaho.reporting.engine.classic.core.util.TypedTableModel; 


    PrintService[] services = PrintServiceLookup.lookupPrintServices(
        DocFlavor.SERVICE_FORMATTED.PAGEABLE, null);
    TypedTableModel tt = new TypedTableModel();
    tt.addColumn("ID", String.class);
    tt.addColumn("Value", String.class);
    for (int i = 0; i < services.length; i++)
    {
      PrintService service = services[i];
      PrinterName displayName = service.getAttribute(PrinterName.class);
      if (displayName != null)
      {
        tt.addRow(new Object[]{service.getName(), displayName.getValue()});
      }
      else
      {
        tt.addRow(new Object[]{service.getName(), service.getName()});
      }
    }
    return tt;
 

Mondrian, XML/A and the Olap4J datasource

When we started with Pentaho Reporting 3.5.0, one of our goals was to kick out as many hard-coded dependencies as possible. Coding against private APIs is ugly, every upgrade breaks something and you always chase your own tail. In short: It is not fun.

The OLAP4J datasources are among the more promising new APIs that emerge. Originally, I had the hope to completely kick out every Java source file that contained the words “import mondrian.”. So far I am still waiting to pull the plug from the Mondrian datasource to make OLAP4J the primary OLAP datasource. Hurry up, sticking with 0.x versions for years and years is soooooo lame. Where do you guys pick up such bad behaviour?

Right now, the only viable use case for using OLAP4J is to access XML/A Cubes. Sounds not that exciting, but with it the Pentaho Reporting System can talk to SAP BW, Palo and Microsoft’s Analysis server.

How do you do connect Pentaho Reporting to a XML/A Datasource?

  1. Create a OLAP4J datasource in PRD
  2. Create a new connection definition. The Database dialog that pops up is full of JDBC databases. Ignore all of that useless gibberish and select the “Generic database”.

Use the following entries in the fields:

Test the connection and once everything is fine, hit OK.

 You are now set up to run MDX queries and to use the result in a report.

But Thomas, there are so many OLAP4J datasources? Which one shall I use?

Pentaho Reporting comes with three flavours of OLAP datasources.

The Banded Datasource is the one that most reports should use these days. This datasource provides a flattened view over the cube much like the results you see in Analyzer and JPivot. You can easily print that resulting dataset using the classical banded reporting techniques, like relational groups and detail bands.

The Denormalized  Datasource provides a denormalized stream of data. It will be used for the crosstabbing in 4.0, but right now in the majority of cases, it is of not much use. It has its merrits if you need to do your own aggregation on that data.

The Legacy-Datasource behaves mostly like the Banded datasource. It exists to support PRD-3.0 and older reports. Ignore that, you are fresh and modern, after all. The Legacy-datasource names columns differently and cannot handle ragged hierarchies. Some ancient reports require that kind of weird behaviour to continue to work as before.

So use the Banded Datasource and you cannot go wrong.

Can I use OLAP4J datasources in the BI-Server?

Sure. Just do it. But stay clear from declaring them in JNDI, as connection pooling can easily fail. OLAP4J drivers cloak as JDBC drivers to try to make use of connection pools and JNDI systems. For code that was written for JDK 1.5 or earlier, “unwrapping” the driver does not work and then the pooled JDBC objects cannot be used to make a OLAP connection.

I read I can use Mondrian via OLAP4J as well. How?

Although it is technically possible to use Mondrian this way, I heavily recommend against it.

Mondrian encodes a system specific file name into its URL. When Mondrian tries to establish a connection, it tries to read this file. If the file name is a absolute file name, then you will run into troubles when you move your report onto the BI-Server. The referenced file will usually not be available there. If the file name is relative, then Mondrian will resolve the file using the application’s current working directory (for the BI-Server usually Tomcat’s ‘bin’ directory, for PRD either the PRD installation directory or your home directory).

So far I have not seen a safe way to specify the schema file so that it works both locally and when the report is published on a server.

How to upgrade your old BI-Server to Pentaho Reporting 3.7.0

So once again I find myself writing a upgrade guide for the ancient BI-Server releases. It may be futile to say so, but: Hey, this is the last time I am back-porting anything for these dusty creaky collections of bits and bytes.

The next release of Pentaho Reporting will be the 4.0 release, with APIs changing, worlds ending and other mind-altering influences happening. And I surely don’t have the patience to wait until the zombies crumble to dust. So be warned, your clock is ticking too.

Enough of the happy talk, lets talk upgrade.

As a result of the upgrade you will:

There are a few limitations and warnings that come with this upgrade:

  • The Drill-Linking-UI will not auto-populate the parameter information for XActions or XAnalyzer content. 
  • The report-viewer will be upgraded. If you are using invalid report parameter or if you are using report-parameter values that are not acceptable with the parameter-definitions defined in your report, those reports will now always fail. Fix the report definition and the error will go away.
  • Any modification made to the report-viewer’s plugin.xml file will be lost.
  • There is no and will be no upgrade for BI-Server 3.5.0 or earlier versions. Upgrade!
  • The Pentaho-Support-Crew may or may not support such upgraded installations.

For the upgrade you will need:

  • A computer with a Java-5 SDK and Apache ANT installed
  • A Subversion client and knowledge how to check out code from a repository
  • A Pentaho installation on your local disk (and permission to change files there)

This upgrade is relatively easy, and surely easier than the last one. So lets get started.

Step 0: Backup your Pentaho installatio

Don’t skip that part. The upgrade will delete the old reporting files and will install new ones. Always make sure that you can return to the pre-upgrade state. 

Step 1: Create a directory for the source-code and the build files.

mkdir /home/user/pentaho

Step 2: Check out the source code of the reporting plugin that matches your BI-Server installation.

In this manual, I will use a command line client. However, any Subversion client will do the job.

BI-Server 3.5.2:

cd /home/user/pentaho
svn co http://source.pentaho.org/svnroot/platform-plugins/reporting-plugin/branches/3.7-backport-3.5.2/ reporting-plugin

BI-Server 3.6.0:

cd /home/user/pentaho


svn co http://source.pentaho.org/svnroot/platform-plugins/reporting-plugin/branches/3.7-backport-3.6.0/ reporting-plugin

Step 3: Edit the build.properties file to point to your BI-Server installation

There are two possible scenarios, depending on how you installed your Pentaho BI-Server:

(1) BI-server pre-configured installation

This is the standard installation type when you install the Pentaho-BI-Server with an EE-installer or from a ZIP or Tgz file from Sourceforge. You only need to modify a single setting:

install.target-dir=

Example:

install.target-dir=/opt/pentaho-bi-server

(2) A custom installation in a J2EE Web-application server.

The installation process has to delete some old files and copies a couple of new files into the web-application. You have to make sure that the WAR-file is extracted somewhere for the upgrade. WAR files are ZIP files so any unzip tool will do the job.

 
You will have to set two settings in the build.properties file. Note that there is no entry for “install.lib-dir” in that file. You have to create one on a new line.

install.target-dir=
install.lib-dir=

Example:
For this example I will assume that your pentaho-solutions directory is “/srv/pentaho/pentaho-solutions”. I further assume your unzipped WAR file sits in “/home/user/pentaho-war” so that you can see a directory called “/home/user/pentaho-war/WEB-INF/lib”.

install.target-dir=/srv/pentaho
install.lib-dir=/home/user/pentaho-war/WEB-INF/lib

Step 4: Download the libs and build the jars

Assuming you have Apache Ant installed, you can run

ant resolve dist

Otherwise, shame on you for skipping the requirements and then read: http://ant.apache.org/manual/install.html

Step 5: Ensure you have made your backup.

Step 6: If you patch a Pre-Configured Installation or an other J2EE server’s work-directory then stop your BI-Server now.

Step 7: Install the artifacts

The ant-script contains all information to patch your WAR file or your Pentaho-PreConfigured Installation. Simply run:

ant install 

Step 8: Start your BI-Server. Login and enjoy your new reporting engine.

Supporting the old population – BI-Server 3.5.2 and 3.6.0

Now that the end of the traditional calendar year is near and Samhain is fast approaching, it is time to take care of the dead corpses of the old and existing production installations out there.

Personally, I am a big fan of instant upgrades. As soon as a new release is out, upgrade. Agreed, I am biased as every old installation means I have extra trouble with support and bug reports. Every old installation gone means less work for me. Isn’t that cool?

But there are those boring people with arguments like “cant upgrade a tested installation that is in production” and “never change a system that already works”. As those people also fall into the category of being “honourable Pentaho customers”, I quell the urge to scream “Get over it, what’s live without a bit of risk and fun”.

Pentaho Reporting 3.7.0 release ante portas

So here is my personal take on that problem. Note that my preference does not affect your support plans or dictates what Pentaho as company can and will do or can and will support. It just affects what I do in regard to feature and support requests that come to me via the open channels like the forum, e-mail or personally addressed blackmail.

This release will be out somewhere this year. Note how carefully I avoid any specific dates. It will be released when it is finished or when our Sales and Marketing team grow tired of waiting and invade the developer dungeon to get hold of the treasure.

Pentaho Reporting 3.7.0 will resurrect the dead BI-Server corpses

After that release I will branch the 3.7 codeline to retrofit it into the BI-Server 3.5.2 and 3.6.0 codebase. At the end of that process we will be able to upgrade the existing BI-Server 3.5.2 and 3.6 installations with the new reporting engine.

The server will still be mainly 3.5.2 code, as I do not plan to touch any of the BI-Server’s core projects. The “reporting-plugin” and the “pentaho-reporting-classic-engine” will be the only things that change.

The automatic parameter discovering in PRD for Drill-Linking will only be supported for links to reports. XActions and Analyzer do not support the correct parameter format and I dont feel tempted to mess with their sources (and potentially break things on the way). However, when you know the parameter names, you can always add the parameter to the “Manual Parameter” section of your Drill-down definition.

All other reporting related features will work as if you had a BI-Server 3.7.0 release.

Let the dead corpses rest in peace: No support from me for 0.8.9 and 0.8.10

I will make no effort whatsoever to support BI-Server 3.5.0 or anything that uses the old 0.8.something reporting engines. That code is so old that even my local necromancer would have trouble getting that back to life. I ended all support for that some time ago and although I happily answer questions from time to time, I will not open up that code in my shiny and clean IDE. If you are still working with that code, consider to upgrade, or be prepared to work on the branch alone.

Performance tuning settings for Pentaho Reporting

General thoughts on report processing and performance

Performance of PR is mainly dependent on the amount of content printed.
The more content you generate, the more time we will need to perform
all layout computations.

Use Inline Subreports with care

Large Inline-subreports are the most notorious reason for bad performance.
The layouted output of a inline-subreport is always stored in memory. Layouting
pauses until the subreport is fully generated and then inserted into the layout
model and subsequently printed. Memory consumption for this layouting
model is high, as the full layout model is kept in memory until the
report is finished. If the amount of content of the subreport is huge,
you will run into out-of-memory exceptions in no time.

A inline-subreport that consumes the full width of the root-level band
should be converted into a banded subreport. Banded subreports are
layouted and all output is generated while the subreport is processed.
The memory footprint for that is small as only the active band or the
active page has to be held in memory.

Resource Caching

When images are embedded from servers (HTTP/FTP sources) it is critical
for good performance that the server produces a LastModifiedDate header.
We use that header as part of the caching. A missing header means we
do not cache the resource and will reload the image every time we access it.

As a general rule of thumb: Caching must be configured properly via
a valid EHCache file. If caching is disabled or misconfigured, then
we will run into performance trouble when loading reports and resources.

Performance Considerations for Output types


Within PR there are three output types, each with its own memory and CPU
consumption characteristics.

(1) Pageable Outputs

A pageable report generates a stream of pages. Each page has the same
height, even if the page is not fully filled with content. When a page is filled,
the layouted page will be passed over to the output target to render it
in either a Graphics2D context or a streaming output (PDF, Plaintext,
HTML etc).

Prefer “break-after” over “break-before” pagebreaks.

When the content contains a manual pagebreak, the page will be considered
full. If the pagebreak is a “before-print” break, the break will be
converted to a “after-break” and the internal report states will be rolled
back and parts of the report processing restarts to regenerate the layout
with the new constraints. A similar roll-back happens, if the current
band does not fit on the page.

Stored PageStates: Good for Browsing a report, but eat memory

When processing a pageable report, the reporting engine assumes that
the report will be run in interactive mode. To make browsing through
the pages faster, a number of page-states will be stored to allow us
to restart output processing at that point.

Reports that are run to fully export all pages usually do not need
to store those pagestates. A series of settings controls the number
and frequency of the pagestates stored:

org.pentaho.reporting.engine.classic.core.performance.pagestates.PrimaryPoolSize=20
org.pentaho.reporting.engine.classic.core.performance.pagestates.SecondaryPoolFrequency=4
org.pentaho.reporting.engine.classic.core.performance.pagestates.SecondaryPoolSize=100
org.pentaho.reporting.engine.classic.core.performance.pagestates.TertiaryPoolFrequency=10

The reporting engine uses three lists to store the page-states. The default
configuration looks as follows:

The first 20 states (Pages 1 to 20) are stored into the primary pool. All states
are stored with strong references and will not be garbage collected.

The next 400 states (pages 21 to 421) are stored into the secondary pool. Of those
every fourth state is stored with a strong reference and cannot
be garbage collected as long as the report processor is open.

All subsequent states (pages > 421) are stored in the tertiary pool
and every tenth state is stored as strong reference.

For a 2000 pages report a total of about 270 states will be stored with strong references.

In server mode, the settings could be cut down to

org.pentaho.reporting.engine.classic.core.performance.pagestates.PrimaryPoolSize=1
org.pentaho.reporting.engine.classic.core.performance.pagestates.SecondaryPoolFrequency=1
org.pentaho.reporting.engine.classic.core.performance.pagestates.SecondaryPoolSize=1
org.pentaho.reporting.engine.classic.core.performance.pagestates.TertiaryPoolFrequency=100

This reduces the number of states stored for a 2000 page report to 22, thus cutting
the memory consumption for the page states to a 1/10th.

(Note: In PRD 3.7 full exports no longer generate page states and thus these settings
will have no effect on such exports. They still affect the interactive mode.)

(2) Table exports

A table export produces a table output from a fully layouted display model. A
table export cannot handle overlapping elements and therefore has to remove
such elements.

To support the debugging of report layouts, we store a lot of extra information
into the layout model. This increases the memory consumption but makes developing
reporting solutions easier. These debug settings should never be enabled in
prodcution environments. In 3.6 and earlier the pre-built “classic-engine” has them enabled, as this helps inexperienced developers to find their report-definition errors faster.

org.pentaho.reporting.engine.classic.core.modules.output.table.base.ReportCellConflicts=true
org.pentaho.reporting.engine.classic.core.modules.output.table.base.VerboseCellMarkers=true

Note: With PRD-3.7, the defaults for these settings will change to “false” as
we assume that most users use PRD for developing reports now. PRD comes with
its own method to detect overlapping elements and does not rely on these settings.

Special Notes on the HTML export

In HTML exports, there are a few settings that can affect export performance.

org.pentaho.reporting.engine.classic.core.modules.output.table.html.CopyExternalImages=true

This controls whether images linked from HTTP(S) or FTP sources are linked from their
original source or copied (and possibly recoded) into the output directory. The
default is “true” as this ensures that reports always have the same image.

Set to false if the image is dynamically generated and should display the most
recent view.

org.pentaho.reporting.engine.classic.core.modules.output.table.html.InlineStyles=false
org.pentaho.reporting.engine.classic.core.modules.output.table.html.ExternalStyle=true
org.pentaho.reporting.engine.classic.core.modules.output.table.html.ForceBufferedWriting=true

The style settings and the buffered writing settings control how stylesheets are produced and whether the generated HTML output will be held in a buffer until the report processing is finished.

Style information can either be inlined, stored in a external *.css file or
can be contained in the element of the generated HTML file.
(Inlinestyles == false and ExternalStyle == false)

Buffering is forced when styles need to be inserted into the element of a
report. Buffering should be set to true if the resulting report is read by a
browser, as browsers request all resources they find in the HTML stream. If a
browser requests the stylesheet that has not yet been fully generated, the report
cannot display correctly.

It is safe to disable buffering if the styles are inlined, as the browser will
not need to fetch a external stylesheet in that case.

Buffered content will appear slower to the user than non-buffered content, as
browsers render partial HTML pages while data is still received from the server.
Buffering delays that rendering until the report is fully processed on the server.

BI-Server parameter input: An authoritative voice

Over the last few release cycles, we have spent some tremendous
time in making the parameter input easy to use. Along with the
community and user feedback the GWT client received new capabilities
on when and how to pass parameters around.

We strive for a release it quick and release it often approach,
as we rather solve pain in a suboptimal way today than to wait for
a perfect solution that comes next year, if ever. And thus it is a
sad (and rather natural) truth that not all attempts are hitting
the spot.

Especially the auto-submit feature is a creepy little bugger and
has seen numerous hacks, tweaks and finally a full make-over in
the upcoming 3.7 release.

Architecture: the inner workings of the reporting plugin in 3.7

The reporting plugin is a GWT application, and thus when first
invoked, it will initialize itself, inspect all parameters it
received from the URL and fires a non-paginating parameter-request
back to the server.

On the server, the Parameter-content-handler handles the request.
It read all values from the URL. URLs only transmit strings, so
in a second step, those raw values get parsed into Java-Objects.
The parsed values now get passed down into the reporting engine
for further validation. The engine validates the parameters and
either accepts the values as fully valid or spits out a bunch of
error messages.

If all values are valid and the request asked for pagination, we
also paginate the report to return the total number of pages for
the report.

The validation and pagination result, along with a description of
all available parameters and their accepted values are sent back
to the GWT UI.

The first parameter-response now initializes the GWT application
and sets the initial state of the auto-submit feature. If the
GWT UI detects that all parameters have been accepted as
valid, and if auto-submit is enabled, it now fires a full parameter
request that paginates the report.

Subsequent updates will then follow a slightly different protocol:

If auto-submit is disabled, any user-input triggers a lightweight
parameter validation request. This ensures that list-parameters
always get selections based on the actual user input. The response
only updates the parameter definitions and values and at no point
the report gets executed.

When auto-submit is enabled, we always fire heavyweight parameter
requests, which trigger a pagination run on the server. When such
a request returns without error, we do show the report content.
This finally invokes the report-content-generator and creates
the actual report content that is shown below the parameter input
pane.

The BI-Server 3.6.0 Situation

In this version all parameter validation requests were
heavy weight requests. So every parameter validation triggered
a pagination.

A pagination run is only triggered if all parameter were validated
successfully. To turn the heavy weight parameter requests into a
3.7-style lightweight request, you need to add a parameter that
always validates to false, until the user explicitly selects it.
One simple way of doing that is to add a mandatory check-box
parameter with the values “Wait” and “Run” and the post-processing
formula

=IF([p] = "WAIT"; NA(); [p])

that translates all wait into values and thus making the
parameter unvalidatable until the user selected “run”.

Fixed rules: More on Parameter processing

In the famous “lets do it right this time” release of Pentaho Reporting 3.5,
we introduced the ability to have parameter on a report. Well, it wasn’t quite
right, with parameters you need to pre and post process the data to make it
sound. That was release 3.6. At that point, so our theory, you, dear user,
should be happy. But apparently, the beast we created wasn’t all pretty.

Well, its PRD-3.7 now and guess what we are improving: Parameters.

So far, the date parameter processing was not quite right. I still wonder
why after 5 years of XAction no one complained about that. Sure, XActions
only have strings, and any processing or parsing is up to you – and so is the
blame if it does not work.

The various system level options on the parameter UIs was .. sub-optimal.
(I’m getting better at phrasing it more positively, don’t you think?)
The list of supported parameter (aka “the list of parameters you shall not
use in your report”) grew with every release. The Swing UI and the server UI
never quite agreed on what setting to accept and how to behave in border
cases. Thus creating formulas that worked in both settings was a chore.

And last but not least: Validating parameters and getting them run in a
consistent way was difficult. Give a Integer where a Long was expected
and you are screwed. Without a error message. Thus even for me working with
the parameters was more a easter-egg search than sane designing.

And last but not least: Even the parameter processing order was a bit
funny. It works for simple cases, but behaves rather funny for the
not so simple ones.

How Pentaho Reporting Processes Parameters

Each parameter in Pentaho Reporting carries at least two formulas that
eventually need to be evaluated.

The default-value-formula is used to produce a valid value if the user
provided no value.

The post-processing-formula is used to transform the user’s input into
something more usable or simply to validate arbitrary business rules
(a deposit cannot be negative, for instance).

And last but not least, if you reference an other parameter, you expect
it to contain the proper post-processed value.

In PRD-3.6, the order of the validation was largely out of sync with
those expectations. In fact, post processing was done in blocks, so that
parameter were not able to use other post-processed parameter values in
their queries. Now that’s bad, and I guess Gretchen will be able to share
a few unhappy tales in Lisbon about that.

In PRD-3.7, each parameter is now fully processed on its own before
the next defined parameter in the chain is processed.

Lets be more formal for a while:

For each parameter defined:

If the value for the parameter is <null>, we compute the parameter’s
default value and use that as untrusted parameter value. The default-value
formula only sees the previously validated parameters.

In a second step, we post process the parameter to get a trusted value.
The post processing formula sees the previously validated parameters
and the untrusted value. So be careful how you use the untrusted value
here, as you cannot trust users and SQL-injections or cross-site-scripting
troubles are never to far away.

If the post-processing formula fails with an error the
trusted value of the parameter will be <null>, a warning message will be
issued and last but not least we refuse to execute the report. The
parameter processing continues with this value set to <null>.

And finally we check the type of the parameter and compare the parameter
value against the list of valid key-values. If the value passes this test
it becomes a trusted value and will be used in the further parameter
processing and ultimately it will be used in the report.

If the parameter fails the test, we report an error, prevent any report
processing and continue to validate the remaining parameters using the
parameter’s default value.

Beginning with this version, the parameter validation also creates the
set of validated values after the validation is complete. For a report without
any parameter values set, this will yield the default values for all parameters.

So what does this mean for you?

The new schema brings a couple of changes to the way the system behaves.
Default values are now context sensitive and can change when the
selection for the previously declared parameters changes. Our parameter
UIs do not directly use that feature for usability reasons.Automatically changing
the user’s input is not very nice and confuses and/or upsets people. A lot.

The post processing formulas are now executed in a timely manor and before
the default-value or selection for a parameter is computed. This way, you
are now able to compute the mondrian-role array in a hidden parameter’s
post-processing formula and be sure that your datasource sees it.

And last but not least, your formulas wont be able to use values that have
not been validated, nor would the report ever include them. Especially with
the SINGLEVALUEQUERY and MULTIVALUEQUERY formula functions, this is mandatory.
Your database is yours and we all want to keep it that way.

How to work with Advanced SQL/MDX Datasources efficiently

When creating complex reports or even a Guided AdHoc Report you usually need to modify the structure of the report’s query. And this inevitably means that you use a Advanced SQL or Mondrian/OLAP4J data-source along with a calculated query.

What is a Advanced Data-Source

An Advanced data-source is a data-source that only configures the connection. Instead of configuring the query at design-time, it tries to interpret the report’s query as valid SQL or MDX statement. The value for the query can then be computed at runtime using either a formula or any other expression.

Parameter values are specified via the ${PARAMETERNAME} syntax within the query. Ordinary parametrization in SQL data-sources uses JDBC-PreparedStatements for filling in the parameter values. The JDBC-standard limits this kind of parametrization to pure value replacement, and makes it impossible to replace column names or any other structural element, like adding or changing a ORDER BY clause.

When using a formula to compute the query, those limitations are lifted. Parametrization now happens by doing string concatenation to calculate the SQL statement. This now allows you to inject any SQL fragments into your query at any place and in any fashion you like.

="SELECT * FROM Customers ORDER BY " & [Sorting]

Warning – SQL-Injection: With great powers comes great responsibilities

While this technique is powerful, it is also dangerous: Injecting user-supplied values is commonly known as SQL-Injection and a great way for hackers to enter your server. So make sure that you only use properly validated SQL-fragments.

If you do not validate the input, your users can supply dangerous values for Sorting, like this one:

COLUMN; DELETE FROM TABLE;

which would produce this scary SQL statement

SELECT * FROM Customers ORDER BY COLUMN; DELETE FROM TABLE;

which can delete all rows from your table. (Whether this is successful also depends on your database and JDBC driver. But do you want to take the risk?)

Both the Advanced SQL and Advanced Mondrian/OLAP4J data-sources still allow the Prepared-Statement parametrization in addition to the formula computation. So if you have to parametrize user-supplied values, do it via the classical ${PARAMETERNAME} syntax and only use the formula parametrization with validated parameters.

Designing Reports with Advanced Data-Sources

Inside the Pentaho Report Designer, Advanced SQL-Data-sources do not show field names in the various field pickers. The query is only calculated when the report is run, and thus the design-time environment has not enough information to retrieve data from the data-source. This makes it hard to work with such reports – you always have to remember how your columns are named, which is no fun at all.

But there is a trick! There is always a trick ..

A report can have definitions for both the static value and a formula for the query-attribute at the same time. When the report is executed the formula will be evaluated and the static value will be ignored. At design-time, the Report-Designer only uses the static value and ignores the formula.

Add the Advanced SQL datasource to the report and add the formula for the query-attribute to configure the report’s behaviour at runtime. Then add a standard SQL-Datasource (or just a plain Table-Datasource) to the report, configure it with a suitable query that returns columns with the same names and types as the computed query and set the report’s static query-attribute to the name of that query. You should now see the columns of the standard data-source at design-time and see the data from the calculated query via the Advanced Datasource when the report runs.

Warning: You have to make sure that the Advanced data-source is positioned after the standard data-source or this trick will fail.